


MarketXero Footprint Pro User Guide
Order Flow Analysis with Footprint Bars
The MarketXero Footprint Pro indicator transforms traditional price bars into detailed order flow footprints, revealing the order flow dynamics that drive price movement. Unlike standard charts that only show price action (OHLC), footprint analysis displays the battle between buyers and sellers at every price level within each bar.
Install and Setup
License Activation
- Purchase subscription at portal.marketxero.com
- Add NinjaTrader username to your portal account settings
- Install indicator via downloaded ZIP file from portal
- Restart NinjaTrader – license validates automatically on first load
Adding to Chart
- Right-click chart → Indicators
- Locate “MarketXero Footprint Pro”
- Click Add → Configure settings → OK
Getting Started
- Start with default settings
- Enable Volume imbalance and Divergence/Absorption
- Gradually add features as you understand them
- Focus on one or two markets initially
- Practice on replay/simulation before live trading
Remember
Order flow analysis is a skill that develops over time. The MarketXero Footprint Pro indicator provides the tools, but successful trading requires practice, patience, and continuous learning. Focus on understanding market dynamics rather than just following signals.
Color Section
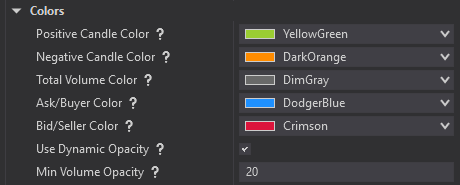
Candle Colors
Positive Candle Color
Color for bullish candlesticks where the closing price is higher than the opening price.
Bullish Candle Characteristics
- Close > Open (price moved up during the period)
- Represents net buying pressure over the time frame
- Shows that bulls controlled the footprint outcome
- Indicates positive price momentum
Negative Candle Color
Color for bearish candlesticks where the closing price is lower than the opening price.
Bearish Candle Characteristics
- Close < Open (price moved down during the period)
- Represents net selling pressure over the time frame
- Shows that bears controlled the footprint outcome
- Indicates negative price momentum
Total Volume Color
Color for total volume bars when Display Mode is set to ‘DeltaTotal’.
- Total Volume = Bid Volume + Ask Volume combined
- Shows overall trading activity at each price level
- Represents total liquidity and interest at that price
- Used in right-column when in ‘DeltaTotal’ display mode
Ask/Buyer Color
Color for Ask volume bars representing aggressive buyers (market buy orders).
- Ask volume = Buyers hitting the ask price (aggressive buying)
- Market orders to buy that removed liquidity from sellers
- Represents bullish pressure and demand
- Shows where buyers were willing to pay the offered price
Trading Insight
- High ask volume at key levels can indicate strong buying interest and potential support
- High ask volume at key levels can also represent a short-positioned participant getting stopped out
- Stop loss (SL) orders are typically set to fill ‘at market,’ so for a short-positioned participant, this gets filled as an ‘ask order’
Bid/Seller Color
Color for Bid volume bars representing aggressive sellers (market sell orders).
- Bid volume = Sellers hitting the bid price (aggressive selling)
- Market orders to sell that removed liquidity from buyers
- Represents bearish pressure and supply
- Shows where sellers were willing to accept the bid price
Trading Insight
- High bid volume at key levels often indicates strong selling pressure and potential resistance
- High bid volume at key levels can also represent a long-positioned participant getting stopped out
- Stop loss (SL) orders are typically set to fill ‘at market,’ so for a lomg-positioned participant, this gets filled as a ‘bid order’
Dynamic Opacity Integration
Makes volume bars semi-transparent based on relative volume within each bar. The opacity (transparency) of Bid, Ask, Delta, and Total volume bars will be based on volume at each price level per footprint bar. Effective for scanning charts to find bars where volume was concentrated at specific levels. High-opacity areas can become future support or resistance.
- High Volume Levels: 100% color to highlight participant volume dominance
- Low Volume Levels: User set ‘Min Volume Opacity’ level will denote low participant volume and interest at that price level
Display
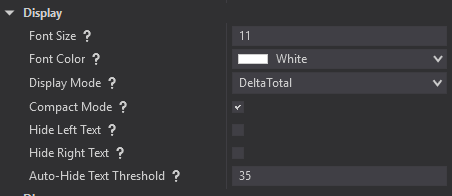
Font Size
Recommended Settings
- 9-11 Best for high-resolution monitors or when zoomed out
- 12-13 Default size for most chart configurations
- 14-15 Larger text for easier reading or lower resolution
Configuration Strategy
Font Color
️Display Mode
DeltaTotal Mode
- Left Column: Delta (Ask Volume – Bid Volume)
- Right Column: Total Volume at each price
- Best for: Order flow analysis and detecting absorption patterns
BidAsk Mode
- Left Column: Bid Volume (selling pressure)
- Right Column: Ask Volume (buying pressure)
- Best for: Seeing raw buying vs selling at each price level
Compact Mode
When to Use
- Chart zoomed out showing many bars
- Smaller monitor resolutions
- Limited bar width situations
Effects
- Reduces spacing between volume bars
- Optimizes text positioning
- Makes bars appear more condensed
Hide Left/Right Column Text
Use Cases
- Chart is too zoomed out for readable text
- Reducing visual clutter while maintaining volume visualization
- Focusing on one column of data
Auto-Hide Text Threshold
Recommended Values
- 0 Never auto-hide (always show text)
- 15-25 Good for most users
- 30-50 More aggressive hiding for cleaner zoomed-out charts
How It Works
Dynamic Opacity System
Makes volume bars semi-transparent based on relative volume within each bar.
How It Works
- Highest volume level = 100% opacity (fully visible)
- Lower volume levels = Proportionally more transparent
- Minimum opacity controlled by separate setting
Benefits
- Quickly identify dominant price levels
- Reduce visual noise from low-volume areas
- Create intuitive volume visualization
- Instantly spot where most trading occurred
Trading Application
Very effective for scanning charts to find bars where volume was concentrated at specific levels. High-opacity areas often become future support or resistance.
Minimum Volume Opacity
Sets minimum transparency for low-volume bars when Dynamic Opacity is enabled.
Opacity Guidelines
- 0-20% Very transparent, dramatic effect
- 25-50% Balanced visibility (recommended)
- 60-80% Subtle transparency differences
Optimization Start with 30-40% for good balance between emphasis and visibility.
Candle Colors
Positive Candle Color = Bull bar (Close > Open)
Negative Candle Color = Bear bar (Close < Open)
Traditional Choices
- Positive: Green (bullish association)
- Negative: Red (bearish association)
AlternativeChoices
- Positive: Cyan, White (bullish association)
- Negative: Purple, Orange (bearish association)
Integration Strategy
Candle colors work with volume analysis. Bull candle with heavy ask volume confirms buying pressure, while Bull candle with heavy bid volume might indicate absorption.
Volume Colors
- Ask/Buyer Color Aggressive buyers hitting ask prices
- Bid/Seller Color Aggressive sellers hitting bid prices
- Total Volume Color Combined volume (Delta|Total mode)
Color Strategy
- Use contrasting colors for easy distinction
- Ensure readability with your font color
- Consider chart background compatibility
- Common: Green/Blue for buyers, Red/Orange for sellers
- Default: Cyan/Purple for Bull/Bear
Divergence/Absorption Analysis
Understanding Divergence/Absorption Signals
Divergence occurs when the participants controlling the candle color (overall bar direction) diverge from participants controlling the delta volume (aggressive orders).
- Absorbed Seller Positive candle despite high bid volume
- Absorbed Buyer Negative candle despite high ask volume
Absorbed Seller Signals
Occurs when aggressive sellers failed to close the candle lower than opening price.
What This Means
- Heavy selling pressure was absorbed
- Buyers defended the level successfully
- Potential bullish continuation or reversal
- Shows buyer strength at that level
Trading Applications
- Look for long opportunities
- Expect potential support at this level
- Combine with other bullish signals
- Watch for follow-through buying
Absorbed Buyer Signals
Occurs when aggressive buyers failed to close the candle higher than opening price.
What This Means
- Heavy buying pressure was absorbed
- Sellers defended the level successfully
- Potential bearish continuation or reversal
- Shows seller strength at that level
Trading Applications
- Look for short opportunities
- Expect potential resistance at this level
- Combine with other bearish signals
- Watch for follow-through selling
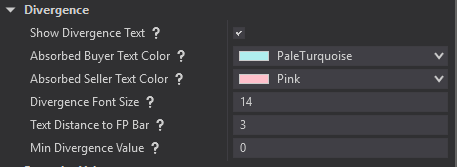
Divergence Configuration
Show Divergence Text
- Enable/disable divergence/absorption signal display.
- Recommendation Enable for divergence/absorption analysis
- Display Text appears above/below bars indicating absorption
Text Colors
- Absorbed SellerColor Text indicating seller absorption (bottom of bar)
- Absorbed Buyer Color Text indicating buyer absorption (top of bar)
- Strategy Use contrasting colors for easy identification
Font Size
Recommendations
- 8-9 Subtle, less intrusive
- 10-12 Standard size for most charts
- 14-16 Prominent, easy to spot
Text Distance
Distance from bar in ticks.
Guidelines
- 2-3 ticks Close to bar, minimal space usage
- 4-6 ticks Balanced distance
- 7+ ticks Far from bar, clear separation
Min Divergence Value
Minimum delta volume to trigger divergence.
Market Guidelines
- ES/NQ 20-30 contracts
- YM 15-25 contracts
- CL/GC 15-30 contracts
- Strategy Higher values = fewer but more significant signals
Divergence Trading Strategies
Strategy 1: Absorption Continuation
- Setup Strong absorption signal in trending market
- Logic Absorption confirms trend strength
Execution
- Identify absorption in direction of trend
- Enter pullback in trend direction
- Use absorption level as support/resistance
- Target next significant level
Strategy 2: Absorption Reversal
- Setup Absorption at key support/resistance
- Logic Shows level being defended
Execution
- Wait for absorption at significant level
- Enter in direction of absorption
- Stop beyond the tested level
- Target return to previous range
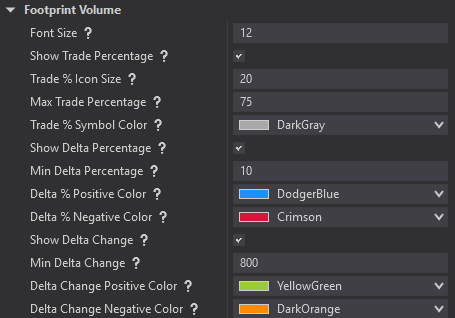
Footprint Volume
Understanding Footprint Volume
The Footprint Volume section provides advanced metrics that reveal market microstructure patterns through trade fragmentation analysis and order flow momentum tracking. These sophisticated tools help identify institutional activity, algorithmic trading patterns, and the behavior of market participants.
Positioning
These icons and volume values all work visually together, along with the Divergence/Absorption volume value, to ‘stack’ automatically on top of each other to avoid visual conflicts. The initial gap between the footprint bar and these values is determined by the ‘Text Distance to FP Bar’ in the Divergence section.
Font Size
Unified font size for all footprint volume metrics (trade percentage, delta percentage, delta change).
Show Trade Percentage
Displays trade percentage (Number of trades/contract volume × 100) above footprint bars when enabled.
Trade Percentage Concept
- Low Percentages Indicate larger average trade sizes (institutional activity)
- High Percentages Indicate more frequent smaller trades (retail/algorithmic)
Trading Applications
- Institutional Detection <75% on ES suggests participants with larger orders active on that footprint bar
- Retail Dominant >80-85% on ES indicates a stronger retail mix
Trade % Icon Size
Font size for the Trade percentage symbol icon. Does not control font size of volume values
Max Trade Percentage
Maximum trade percentage threshold for display filtering the Trade Percentage icon, and will only show the icon with values below this limit.
Trade Percentage Symbol Color
Color for Trade Percentage symbol indicator.
Show Delta Percentage
Displays delta percentage (delta/total volume × 100) above or below footprint bars based on positive/negative values.
Min Delta Percentage
Minimum absolute delta percentage required for display to filter out weak signals.
Absolute Value Filter
- Uses absolute value Both +15% and -15% trigger if minimum is 10%
- Higher Values More selective display of significant imbalances
- Lower Values Show more delta activity including moderate imbalances
Market Adaptation
- Ranging Markets Lower thresholds (5-15%) to catch subtle shifts
- Trending Markets Higher thresholds (20-40%) to filter frequent imbalances
- Volatile Sessions Increase thresholds to focus on most significant moves
- Quiet Periods Decrease thresholds to catch smaller but meaningful shifts
Market Insights
- Values >10% combined with stalled price action at a key level can indicate exhaustion of that side of the participant and a potential reversal
- Combine this with Absorption/Divergence signals to see when passive participants at key levels are absorbing exhausted participants for a stronger confluence of signals to reverse market direction
Delta Percentage Positive Color
Background color for positive delta percentage text rectangles.
Delta Percentage Negative Color
Background color for negative delta percentage text rectangles.
Show Delta Change
Displays delta change (current delta – previous delta) above or below footprint bars based on positive/negative values.
Trading Applications
- Momentum Shifts Identify acceleration or deceleration in order flow
- Divergence Analysis Spot conflicts between price and delta momentum
- Exhaustion Patterns Decreasing delta change may indicate momentum loss
- Continuation Patterns Increasing delta change suggests momentum building
Market Insights
- Large Delta Changes Often precede significant price moves
- Participant Aggression Shows shifts in market participant behavior
- Momentum Confirmation Confirms or questions price movement validity
- Trend Analysis Helps identify sustainable versus unsustainable moves
Visual Positioning
- Positive Delta Change Displayed above the bar
- Negative Delta Change Displayed below the bar
Min Delta Change
Minimum absolute delta change required for display – filters out minor order flow fluctuations.
Absolute Value Filter
- Uses absolute value Both +1000 and -1000 trigger if minimum is 500
- Higher Values More selective display of significant momentum shifts
- Lower Values Show more delta momentum changes including minor shifts
Optimization Strategy
- Volume Relationship Consider average bar volume when setting thresholds
- Session Adaptation Higher values for volatile sessions, lower for quiet periods
- Market Character Adjust based on typical delta ranges for the instrument
- Signal Quality Balance signal frequency with significance
Integration Strategy for Footprint Volume Metrics
- Trade Percentage Identifies market participant type (institutional vs retail)
- Delta Percentage Shows directional bias strength
- Delta Change Reveals momentum acceleration/deceleration
- Combined Insight Creates complete market microstructure picture
High Volume Threshold Detection
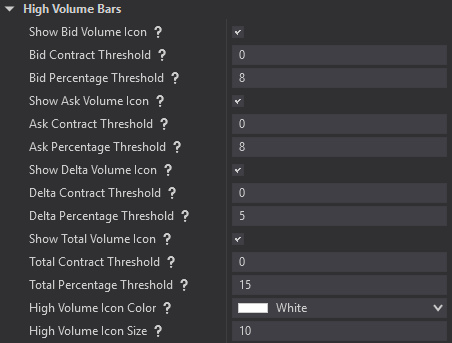
Understanding High Volume Bars
The High Volume Bars section provides sophisticated volume threshold detection using dual-criteria filtering (both contract volume and percentage thresholds). This advanced system helps identify institutional activity, significant accumulation/distribution, and exceptional market participation at specific price levels.
Dual-Threshold Logic
- Icon shows ONLY when BOTH contract AND percentage thresholds are met
- Set one of two values = 0 to ignore that mode
- Example Set Contract Threshold = 0, Percentage threshold = 10, to trigger icon based on values of 10% or greater and ignore contract values
Flexible Usage Strategies
- Contract Focus Set high contract value, low percentage
- Percentage Focus Set low contract value, high percentage
- Hybrid Approach Meaningful values for both
Show Bid Volume Icon
Displays a triangle icon on price levels where bid (seller) volume exceeds your specified threshold.
Bid Contract Threshold
Minimum bid (seller) volume contracts required at a price level to trigger the high volume icon display. Works in conjunction with Bid Percentage Threshold, BOTH must be met.
Bid Percentage Threshold
Minimum percentage of the total footprint bar volume that bid volume must represent to trigger the icon. Works with Bid Contract Threshold, BOTH must be met.
Percentage Calculation
- Formula = (Bid Volume at Price Level / Total Bar Volume) × 100
- Example 300 bid volume ÷ 1000 total volume = 30%
Show Ask Volume Icon
Displays a triangle icon on price levels where ask (buyer) volume exceeds your specified threshold.
Ask Contract Threshold
Minimum ask (buyer) volume contracts required at a price level to trigger the high volume icon display. Works in conjunction with Ask Percentage Threshold, BOTH must be met.
Ask Percentage Threshold
Minimum percentage of the total footprint bar volume that ask volume must represent to trigger the icon. Works with Ask Contract Threshold, BOTH must be met.
Percentage Analysis
- Formula (Ask Volume at Price Level / Total Bar Volume) × 100
- Example 350 ask volume ÷ 1000 total volume = 35%
- Reveals buying concentration relative to total trading activity
Optimization Approach
Set to 0% to ignore percentage and focus purely on contract volume, or combine with contract threshold for sophisticated filtering.
Show Delta Volume Icon
Displays a special icon on price levels where delta volume (Ask – Bid) exceeds your specified absolute threshold.
Strategic Insight
High delta volume often indicates strong conviction by large participants, creating important reference points for future price action.
Delta Contract Threshold
Minimum absolute delta volume (|Ask Volume – Bid Volume|) contracts required to trigger the high delta icon. Works with Delta Percentage Threshold, BOTH must be met.
Absolute Value Logic
- Uses absolute value Both +150 and -150 delta trigger if threshold is 150
- Icon shows ONLY when BOTH contract AND percentage thresholds are met
- Set to 0 to ignore contract minimum (percentage-only mode)
- Focus on extreme directional pressure regardless of direction
Delta Percentage Threshold
Minimum percentage of the total footprint bar volume that absolute delta must represent to trigger the icon. Works with Delta Contract Threshold, BOTH must be met.
Calculation Method
- Formula (|Ask Volume – Bid Volume| at Price Level / Total Bar Volume) × 100
- Example |400 ask – 100 bid| ÷ 1000 total = 30%
- Uses absolute delta value (always positive)
Show Total Volume Icon
Displays a special icon on price levels where total volume (Bid + Ask combined) exceeds your specified threshold.
Total Contract Threshold
Minimum total volume (Bid Volume + Ask Volume) contracts required at a price level to trigger the high volume icon. Works with Total Percentage Threshold, BOTH must be met.
Implementation Logic
- Icon shows ONLY when BOTH contract AND percentage thresholds are met
- Set to 0 to ignore contract minimum (percentage-only mode)
- Typically higher than individual Bid/Ask thresholds (combined volume)
- Focus on exceptional liquidity concentration
Total Percentage Threshold
Minimum percentage of the total footprint bar volume that total volume at a price level must represent to trigger the icon. Works with Total Contract Threshold, BOTH must be met.
Percentage Framework
- Formula (Total Volume at Price Level / Total Bar Volume) × 100
- Example 450 total volume ÷ 1000 total volume = 45%
- Represents concentration of all trading activity at that price
High Volume Icon Color
Color for all high volume threshold icons (Bid, Ask, Delta, and Total volume icons).
High Volume Icon Size
Font size for the high volume threshold icons displayed on exceptional volume bars.
Advanced High Volume Bar Strategies
- Contract + Percentage Most sophisticated filtering approach
- Contract Only Set percentage to 0%, focus on absolute volume
- Percentage Only Set contract to 0%, focus on relative concentration
- Market Adaptation Adjust thresholds based on typical volume patterns
Point of Control & Value Area
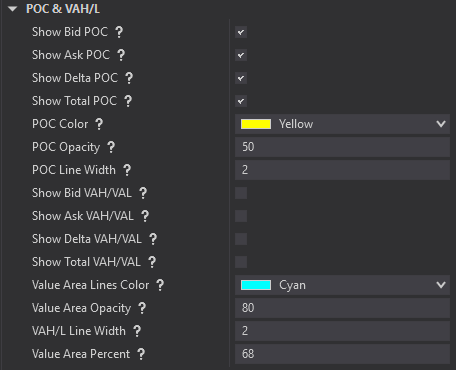
Understanding Point of Control
The Point of Control (POC) represents the price level with the highest volume within a footprint bar. It’s the “fair value” where most participants agreed to trade.
Why POC Matters
- Shows where most trading activity occurred
- Represents market-accepted “fair price”
- Often becomes future support/resistance
- Indicates institutional participation areas
POC Types Available
Bid POC
Price level with highest bid (seller) volume.
- Where sellers were most aggressive
- Highest concentration of selling pressure
- Potential resistance where sellers defended
Trading Applications
- Identify key selling zones for resistance
- Spot absorption when price holds above bid POCs
- Track seller commitment areas
Ask POC
Price level with highest ask (buyer) volume.
Represents
- Where buyers were most aggressive
- Highest concentration of buying pressure
- Potential support where buyers stepped in
Trading Applications
- Identify buying zones for support
- Track buyer accumulation areas
- Ask POCs often become future support levels
Delta POC
Price level with highest delta (Ask – Bid volume).
Represents
- Greatest imbalance between buyers/sellers
- Where one side overwhelmed the other
- Most significant order flow imbalance point
Trading Significance
- Positive Delta POC Buyers dominated (potential support)
- Negative Delta POC Sellers dominated (potential resistance)
- Shows where aggressive participants made their stand
Total POC
Price level with highest total volume (Bid + Ask).
Represents
- Most overall trading activity
- Combined buying and selling concentration
- Traditional “fair value” measurement
Applications
- Classic support/resistance identification
- Shows where market found most “value”
- Standard POC measurement in Market Profile
POC Configuration
POC Color
Color for POC highlight lines.
Selection Tips
- Use bright, contrasting colors (Yellow, Orange, Cyan)
- Avoid colors similar to volume bars
- Consider transparency settings
POC Opacity
Controls transparency of POC lines.
Recommendations
- 70-85% Strong visibility (recommended)
- 40-60% Balanced without overwhelming
- 90-100% Maximum prominence
POC Line Width
Thickness of POC highlight lines.
Guidelines
- 3-4 pixels Standard thickness (recommended)
- 1-2 pixels Subtle lines
- 5-6 pixels Bold, prominent lines
Value Area Analysis
Value Area represents the price range containing a specified percentage of total volume. Traditional Market Profile uses 68%.
Components
- VAH (Value Area High) Upper boundary
- VAL (Value Area Low) Lower boundary
- Volume contained Usually 68% of total volume
Value Area Types
Bid Value Area
Based on bid (seller) volume distribution.
- Shows where sellers were concentrated
- VAH can act as resistance (heavy selling area)
- VAL shows lowest prices with seller activity
- Strategy Watch for resistance at Bid VAH levels
Ask Value Area
Based on ask (buyer) volume distribution.
- Shows where buyers were concentrated
- VAL can act as support (heavy buying area)
- VAH shows highest prices with buyer activity
- Strategy Watch for support at Ask VAL levels
Delta Value Area
Based on delta volume distribution.
- Shows where strongest imbalances occurred
- Reveals battleground price levels
- Indicates aggressive participant activity
- Advanced Insight Shows where most aggressive orders were active
Total Value Area
Classic Market Profile calculation.
- Traditional support/resistance levels
- Standard “fair value” zone
- Prices outside considered “unfair
- Application Standard Value Area for traditional analysis
Value Area Configuration
Value Area Percent
Percentage of volume contained within VAH/VAL.
Standard Settings
- 68% Traditional Market Profile standard (recommended)
- 70% Slightly wider area
- 80% Much wider, less selective
- 50-60% Tighter, more selective core range
Value Area Colors & Styling
- Line Color Different from POC for clear distinction
- Opacity 60-70% recommended (slightly less than POC)
- Line Width 2-3 pixels (thinner than POC for hierarchy)
Volume Imbalance Analysis
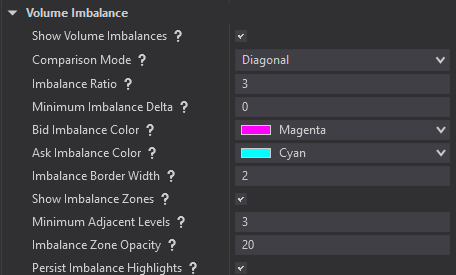
Understanding Volume Imbalances
Volume imbalances occur when adjacent price levels show significantly different volume patterns, indicating aggressive buying or selling that “swept through” certain prices without adequate liquidity to absorb the orders.
Key Concepts
- Imbalances show where limit orders were insufficient
- Often precede continuation moves
- Reveal institutional order flow
- Create areas of future support/resistance weakness
Comparison Modes
Diagonal Comparison (Default)
Compares volume with immediately adjacent price levels.
Benefits
- Most intuitive method for traders
- Reveals traditional order flow imbalances
- Best for identifying continuation patterns
- Standard approach in most analysis
- Use For Bid/Ask Display mode
Horizontal Comparison
Compares bid vs ask volume at same price level.
Benefits
- Shows internal price level imbalances
- Reveals absorption patterns
- Better for identifying reversal patterns
- Highlights aggressor dominance
- Use For Delta/Total Display mode
Configuration Settings
Imbalance Ratio
Minimum volume ratio to trigger imbalance detection.
Examples
- 2.0 2:1 ratio (200 vs 100 volume)
- 3.0 3:1 ratio (recommended start)
- 5.0 5:1 ratio (conservative)
- 10.0 Very selective, extreme imbalances only
Minimum Imbalance Delta
Minimum volume difference required to qualify as imbalance.
Market Guidelines
- ES 20-50 contracts
- NQ 15-40 contracts
- YM 10-25 contracts
- CL 15-35 contracts
- GC 8-20 contracts
Strategy
Acts as noise filter to ensure meaningful signals
Border Colors
- Bid Imbalance Areas where selling pressure insufficient
- Ask Imbalance Areas where buying pressure insufficient
- Recommendation Use contrasting colors (Red/Blue, Orange/Cyan)
Border Width
Thickness of imbalance highlighting (1-10 pixels).
Guidelines
- 1-2 Subtle highlighting (recommended)
- 3-4 Standard thickness
- 5-6 Prominent visibility
- Note Borders drawn outward from volume bars
Imbalance Zones
Extended zones projecting forward from clusters of imbalanced price levels.
Zone Creation
- Requires minimum adjacent imbalanced levels
- Groups consecutive imbalances into zones
- Projects forward as potential targets
- Helps predict future support/resistance
Minimum Adjacent Levels
Consecutive price levels required to create zone.
Recommendations
- 2-3 Sensitive, catches smaller patterns (default)
- 4-5 Balanced approach
- 6-8 Conservative, major disruptions only
- 9+ Very selective, institutional events
Zone Opacity
Transparency of zone extensions.
Guidelines
- 20-40% Light transparency (recommended)
- 40-60% Moderate visibility
- 60-80% High visibility
- Best Practice 25-30% for visibility without overwhelming
Persistence Options
Keep historical imbalance borders visible
- Enable Preserves borders on volume imbalance touched by price
- Disable Focuses on currently active opportunities not touched by price
Note that the persist options for the volume imbalance borders will not affect the display of volume imbalance zones.
Trading Applications
Imbalance Continuation Strategy
- Setup Price approaching imbalance zone in trend direction
- Logic Imbalances often attract price for completion
- Identify imbalance zone ahead of price
- Enter as price approaches zone
- Use zone boundary as target
- Stop beyond recent swing point
Imbalance Reversal Strategy
- Setup Price reaches imbalance zone at key level
- Logic Zone completion may trigger reversal
- Wait for price to fill imbalance
- Look for reversal signals at completion
- Enter counter-trend with tight stop
- Target return to departure point
Zero Prints: Order Flow Disruption
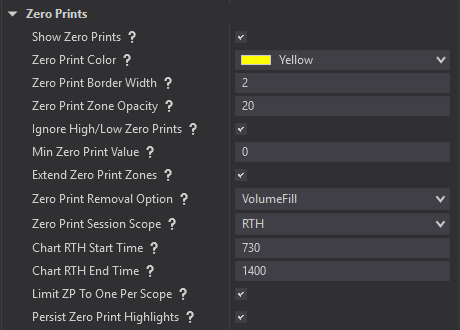
What Are Zero Prints?
Zero prints are price levels within a footprint bar where one side of the market has absolutely zero volume. This creates a powerful signal indicating complete liquidity absence on one side.
Two Types
- Bid volume = 0, Ask volume > 0 (no sellers)
- Ask volume = 0, Bid volume > 0 (no buyers)
Why Zero Prints Matter
Zero prints reveal order flow disruptions, moments when normal auction process breaks down.
Significance
- Liquidity Gap One side completely overwhelmed
- Future Reference Price often returns to test these levels (The market hates a vacuum)
- Directional Momentum Strong pressure cleared all opposing orders
- Institutional Activity Large orders that swept available liquidity
Real-World Example
ES trading at 4850. Large institutional buy order hits all asks from 4850.25 to 4852.75. At 4851.50, no sellers offered contracts (bid volume = 0, ask volume = 150). This creates a bid zero print.
What This Reveals
- Buyers overwhelmed all sellers at 4851.50
- Level may act as support if price returns
- Break below 4851.50 could signal weakened buying pressure
Configuration Settings
Show Zero Prints
Enable zero print detection and highlighting.
- Recommendation ✓ Always enable; foundation of zero print analysis
- Visual Result Volume bars with colored borders around zero print levels
Zero Print Color
Border color for zero print highlighting.
Recommended Colors
- Magenta Unique color that rarely conflicts (default)
- Red High visibility, traditional choice
- Yellow Excellent contrast on most backgrounds
Zero Print Border Width
Thickness of zero print borders (1-10 pixels).
Guidelines
- 2-3 pixels Clean, professional appearance
- 4-5 pixels High visibility for active trading
- 6+ pixels Maximum prominence for education
Ignore High/Low Zero Prints
Excludes zero prints at bar extremes.
- Recommendation ✓ Enable (ignore edge zero prints)
- Reason Edge zero prints are often less significant – insufficient time for both sides to participate
- Zero prints will be created at new session highs and lows and only the zero prints that are created at the highest/lowest session price level will be ignored upon the footprint bar close
Min Zero Print Value
Minimum volume on non-zero side to qualify.
Market Recommendations
- ES/NQ 10-15 contracts
- YM 5-10 contracts
- CL/GC 8-12 contracts
- Strategy Higher values = fewer but more significant signals
Extended Zero Print Zones
Create visual projections forward from zero prints.
Configuration
- Zone Opacity 20-35% for visibility without overwhelming
- Removal Mode Choose “Volume Fill” vs “Price Touch”
Zone Removal Options
Volume Fill
- Zones removed only when actual volume appears
- Bid volume removes bid-side zero prints
- Ask volume removes ask-side zero prints
- Fewer false removals, zones persist longer
Price Touch
- Zones removed immediately when price touches
- No volume requirement
- More responsive, quicker removal
- Higher chance of premature removal
Session Scope Management
Regular Trading Hours (RTH)
Focus on Regular Trading Hours (primary liquidity). Configure primary session times for your market.
RTH Scope
- Focuses on primary liquidity periods
- Excludes low-volume overnight anomalies
- Best for day trading strategies
- Aligns with institutional participation
Common RTH Times
- ES/NQ/YM 930-1600 (9:30 AM – 4:00 PM ET)
- GC 930-1300 (9:30 AM – 1:00 PM ET)
- CL 930-1400 (9:30 AM – 2:00 PM ET)
- 6E 200-1600 (2:00 AM – 4:00 PM ET)
Format 24-hour time in HHMM format
Examples
- 30 = 12:30 AM
- 730 = 7:30 AM
- 1400 = 2:00 PM
- 2130 = 9:30 P
Full Session scope
Include overnight activity (important for futures)
Full Session Scope
- Includes overnight and extended hours
- Complete order flow picture
- Important for swing trading
- Captures pre/post-market activity
Limit to One Per Scope
Prevents repetitive zero print borders and zones at same price level during the user defined session scope
Persistence Settings
Control how long visual elements remain active.
- Enable Historical zero prints stay visible
- Disable Clean chart focused on current opportunities
Trading Strategies
Strategy 1: Zero Print Bounce
- Setup Price approaches previous zero print level
- Watch for support/resistance signs near zero print
- Enter away from zero print (expecting bounce)
- Stop just beyond zero print level
- Target previous swing or next significant level
- Example ES hits bid zero print at 4851.50. Go long at 4851.75, stop at 4851.25, target 4853.00
Strategy 2: Zero Print Breakout
- Setup Price breaks through zero print with volume
- Logic Break confirms the continuation of the original directional pressure
- Wait for decisive break of zero print
- Enter in direction of break
- Use zero print as new support/resistance
- Target measured moves or next level
Strategy 3: Zero Print Failure
- Setup Price fails to hold zero print support/resistance
- Logic Failure suggests original imbalance corrected
- Watch for failure to hold level
- Enter against original zero print direction
- Target return to pre-zero print levels
Common Mistakes
- Failing to set Ignore High/Low Zero Prints = true
- Over-relying on edge zero prints
- Ignoring market context (low-volume periods less reliable)
Pro Tips
- Combine with price action confirmation
- Watch for zero print clusters (stronger levels)
- Consider volume context (high-volume periods more significant)
- Use multiple timeframes (higher timeframes carry more weight)
Trading Strategies
The Triple Confirmation Setup
Divergence/Absorption + Imbalance Strategy at Key Level
Use divergence/absorption signal with volume imbalance zones at key level
Setup
- Identify divergence/absorption signal (volume text)
- Confirm with nearby imbalance zone
- Observe price hold/reject a key level
- Previous HOD/LOD
- PM HOD/LOD
- VWAP
- Enter In direction of particapants that controls price and absorbed traders on the opposite side of trade
- Stop Under supporting volume imbalance zone
- Target Front run key level or imbalance zone
- Maintain a minimum 1:2 Risk:Reward
Futures Benefits
- 24-hour trading may provide more opportunities to take profitable trades. It also provides more opportunities to lose money.
- Higher leverage can mean lower starting balances compared to equities
- Institutional participation creates clearer patterns
- Futures are not beholden to the Pattern Day Trader (PDT) rule, a regulation set by the Financial Industry Regulatory Authority (FINRA)
Critical Mistakes to Avoid
- Relying on single indicator signals
- Failing to have the patience to wait for a convergence of confirmation signals
- Forgetting to adjust for market conditions
- Over-trading low-conviction setups
- Not setting hard stops and respecting them
- R:R less than 1:2
Professional Optimization
- Backtest settings on your specific markets
- Adjust thresholds for volatile conditions
- Combine with traditional technical analysis
- Trends, VX, news, confluence of instrument pairings (ES & NQ)
- Use multiple timeframe confirmation
- Journal every trade
- Regularly review and refine settings. What worked last month may not work this month
