
Cumulative Volume Help
Session volume pace, moving-average baselines, day lookbacks, opening range volume, ATR, chart table, and floating-window reference.
Use Cumulative Volume to decide whether the session has enough participation and range expansion to support the trade you are planning.
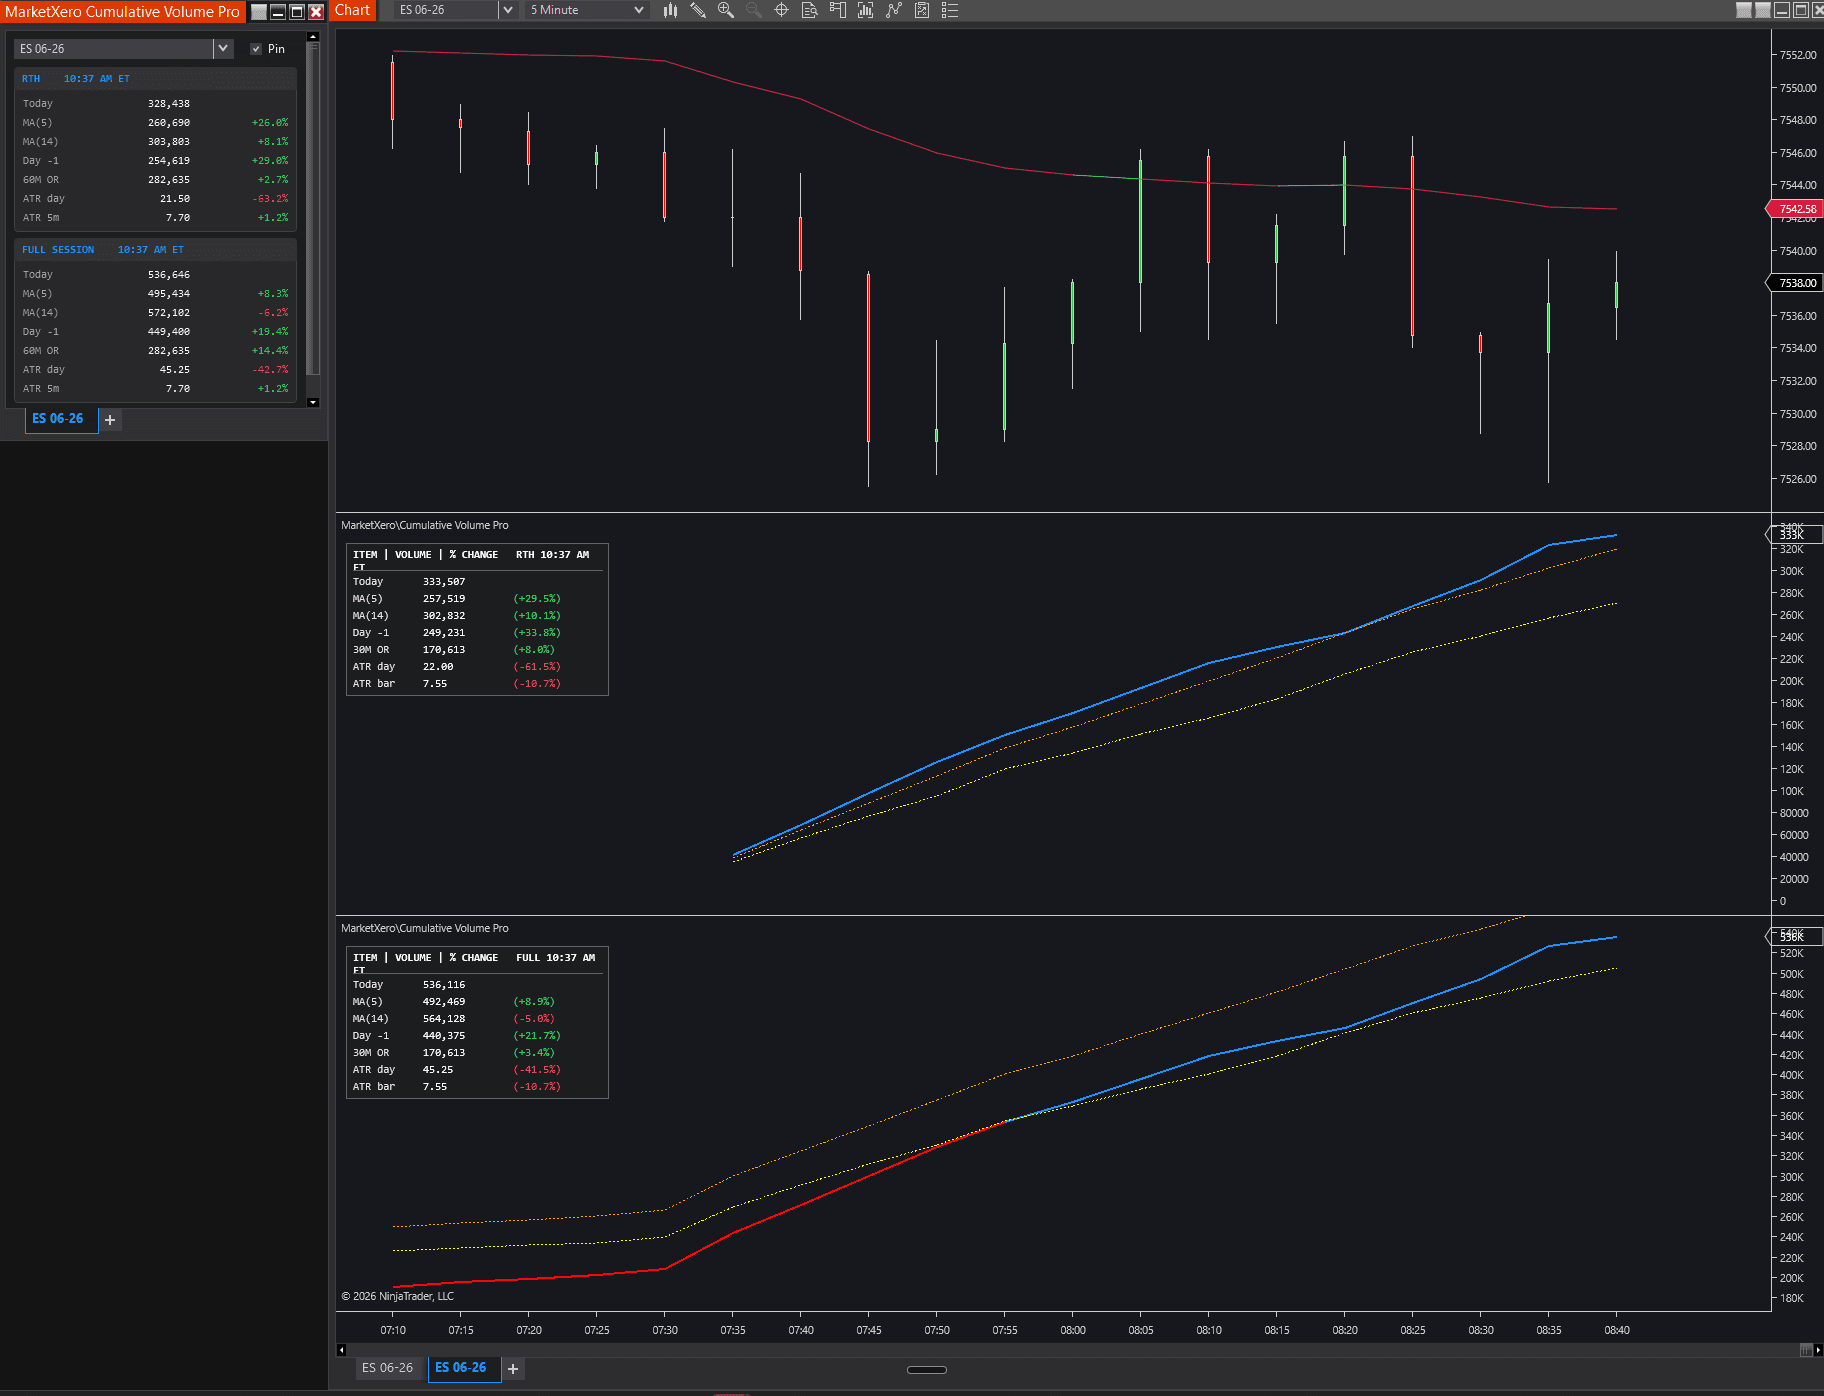
What It Shows
Cumulative Volume measures today's participation against historical baselines at the same time offset in the session.
- Today's cumulative volume is plotted as the active line.
- MA1, MA2, and MA3 calculate average cumulative volume across completed trading days.
- Color crossover can change today's line when it is above or below a selected MA.
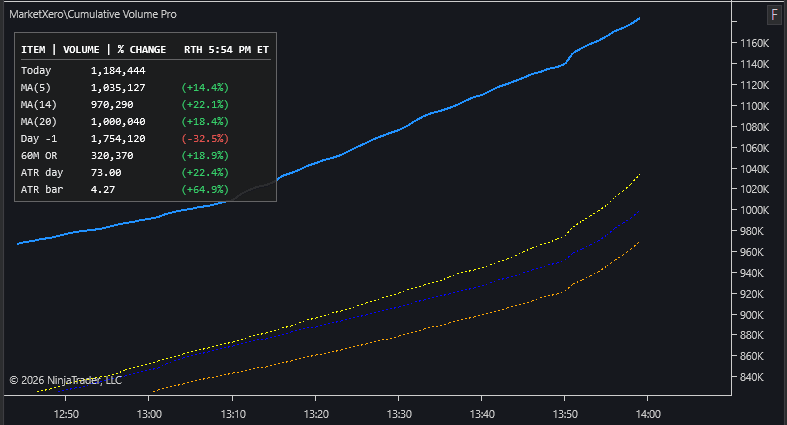
- The chart table can show Today, MA comparisons, specific day lookbacks, opening range volume, ATR day, and bar ATR.
- RTH mode tracks 9:30 AM to 4:00 PM ET.
- Full Session mode tracks the 6:00 PM to 5:00 PM ET futures session.
Chart Indicator Setup
Add MarketXero\Cumulative Volume to a chart when you want the pace view inside the chart panel. It installs under the MarketXero folder and appears as MarketXero Cumulative Volume in the indicator picker.
- The indicator runs Calculate.OnEachTick and renders in its own panel.
- Session Mode can be RTH or Full Session.
- Opening Range Duration controls the OR volume window.
- Minute charts preserve the cleanest time-offset comparisons.
- On non-minute charts, the code snaps comparisons to the chart bar period and prints a warning once.
- Debug settings are available for session and volume troubleshooting but should stay off in normal use.
Data note
The indicator stores volume and ATR by minute offset, then compares the current session to completed historical sessions at the matching offset.
MA Baselines
MA lines answer whether today's participation is above or below the historical pace.
- MA1, MA2, and MA3 each have Enable, Period, Show Line, Show In Table, Color, Dash Style, and Width.
- MA1 defaults to a 5-day period.
- MA2 defaults to a 14-day period.
- MA3 defaults to a 20-day period and is disabled by default.
- Enable Color Crossover changes today's line color relative to the selected trigger MA.
- Color Trigger MA can be MA1, MA2, or MA3.
- Above MA Color, Below MA Color, and Neutral Color control the active line state.
Chart Table
The table is the fastest read when you need numbers instead of another line on the chart.
- Show Table toggles the overlay.
- Table Position can be upper left, upper right, lower left, or lower right.
- Font Size controls the monospace table size.
- Today shows current cumulative volume.
- MA rows show average volume and percentage difference at the current time offset.
- Day -N rows compare today to specific prior sessions, such as yesterday or last week's same weekday.
- Opening Range, ATR day, and ATR bar rows appear when range options are enabled.
- Before the session opens, and after it closes, every value shows -- instead of the previous session's numbers, matching the blank volume lines.
Opening Range And ATR
Range rows tell you whether today's participation is paired with real range expansion.
- Opening Range Duration accepts 5 to 120 minutes.
- Show Daily ATR displays current session range as ATR day and enables the OR volume row.
- Show Bar ATR displays chart-period ATR as ATR bar.
- Range Lookback controls opening-range average, daily ATR average, bar ATR period, and historical time-of-day ATR comparison.
- Common Range Lookback values are 5, 10, 14, and 20.
- Bar ATR uses NinjaTrader's ATR logic on the chart period in the indicator and Wilder-style ATR grouping in the add-on.
Floating Add-On
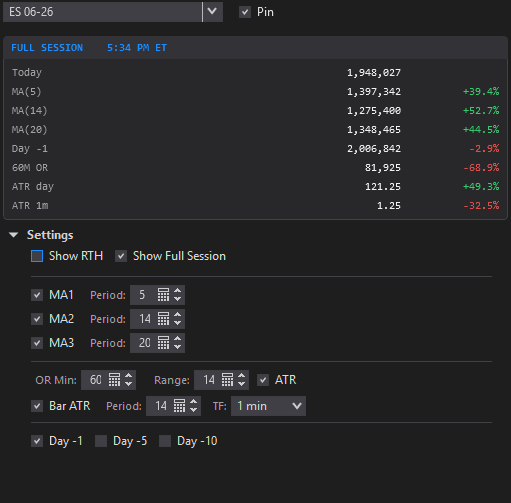
Open the add-on from NinjaTrader Control Center: New -> MarketXero Cumulative Volume.
- The window has an instrument selector and a Pin toggle to keep it on top.
- Show RTH and Show Full Session toggle each session table; show one or both at the same time, with each metric split into current and average rows.
- A single shared Look-back period drives the moving average, the opening-range average, the session-range average, and the Wilder bar ATR together.
- MA, Range, and Bar ATR each have their own on/off checkbox.
- OR Min sets the opening-range window, and the bar ATR TF selects the timeframe its Wilder ATR is measured on.
- Supported bar ATR timeframe choices are 1, 3, 5, 10, 15, and 30 minutes.
- Add-on settings save and restore with the NinjaTrader workspace.
Trading Workflow
Cumulative Volume is a participation filter, not an entry trigger.
- Use it before expanding targets or holding runners.
- If volume and ATR are both above baseline, the day may support wider trade management.
- If volume is below baseline and ATR is compressed, expect thinner follow-through until the data changes.
- Compare today's pace to MA baselines and to specific days that match your playbook.
- Use opening-range volume to judge whether the open had meaningful participation.
- Pair the read with Volume Profile and Key Levels so participation is tied to actual structure.
FAQ
Short answers for setup and first-use questions.
Should I track RTH or Full Session?
Use RTH for cash-session participation. Use Full Session when overnight Globex activity matters to the trade plan.
Does it require a minute chart?
Minute charts are the cleanest fit because comparisons are stored by minute offset. Other bar periods can run, but offsets are snapped to the bar period.
When should I use the floating add-on?
Use the chart indicator when you want lines in a panel. Use the add-on when you want a compact dashboard that can show RTH and Full Session at the same time.