Volume Profile Help
Session profile, value area, POC, LVN, delta profile, previous-day extension, and value migration trail reference for MX-VolumeProfile.
Use Volume Profile when the first question is where the auction accepted trade, rejected trade, or left unfinished structure for the next session.
What It Shows
Volume Profile builds an auction map from traded volume by price. It is designed for context before execution, not for reading individual prints inside one candle.
- Current-day profile can be limited to the current session or expanded to previous sessions.
- RTH mode uses configured session start and end times. Full Session mode uses the full instrument session.
- Value Area Percentage controls VAH and VAL calculation.
- POC marks the highest-volume price in the selected profile.
- Structural POC Mode excludes the closing bar from POC/VAH/VAL calculation when you want to avoid a closing MOC spike distorting structure.
- Delta Profile shows bid-dominant and ask-dominant volume by price.
- LVN zones mark low-volume areas that may become rejection or traversal zones.
Session And Scope
Session settings decide which auction the profile represents. Confirm these before tuning colors or LVN sensitivity.
- Session Time Mode can be RTH or Full Session.
- RTH uses Session Start Time and Session End Time in HHMM format, commonly 930 to 1600 for ES and NQ.
- Full Session uses NinjaTrader's instrument session definition, including overnight activity.
- Profile Scope can show only the current trading day or all previous days available in chart data.
- Sticky Left Previous Day keeps the prior profile pinned left until the following day's start hits the left edge.
- Enable Cache Retention and Cache Retention Days manage how long sessions stay in memory.
First check
If POC, VAH, VAL, or LVNs look wrong, validate session mode and profile scope before changing the detection settings.
Profile Rendering
The main settings group controls the visual profile and labels.
- Show Volume Profile toggles the profile itself.
- Volume Profile Style can render Bars or Outline.
- Outline mode traces the silhouette and can be cleaner on instruments with compressed price levels.
- Volume Profile Width controls how much horizontal chart space the profile occupies.
- Volume Profile Color and Outside Value Area Color separate accepted volume from volume outside the selected value area.
- Value Area Opacity and Outside Value Area Opacity tune the visual weight.
- Show Volume Labels, Minimum Volume for Labels, Volume Label Font Size, and Volume Label Position control numeric volume labels.
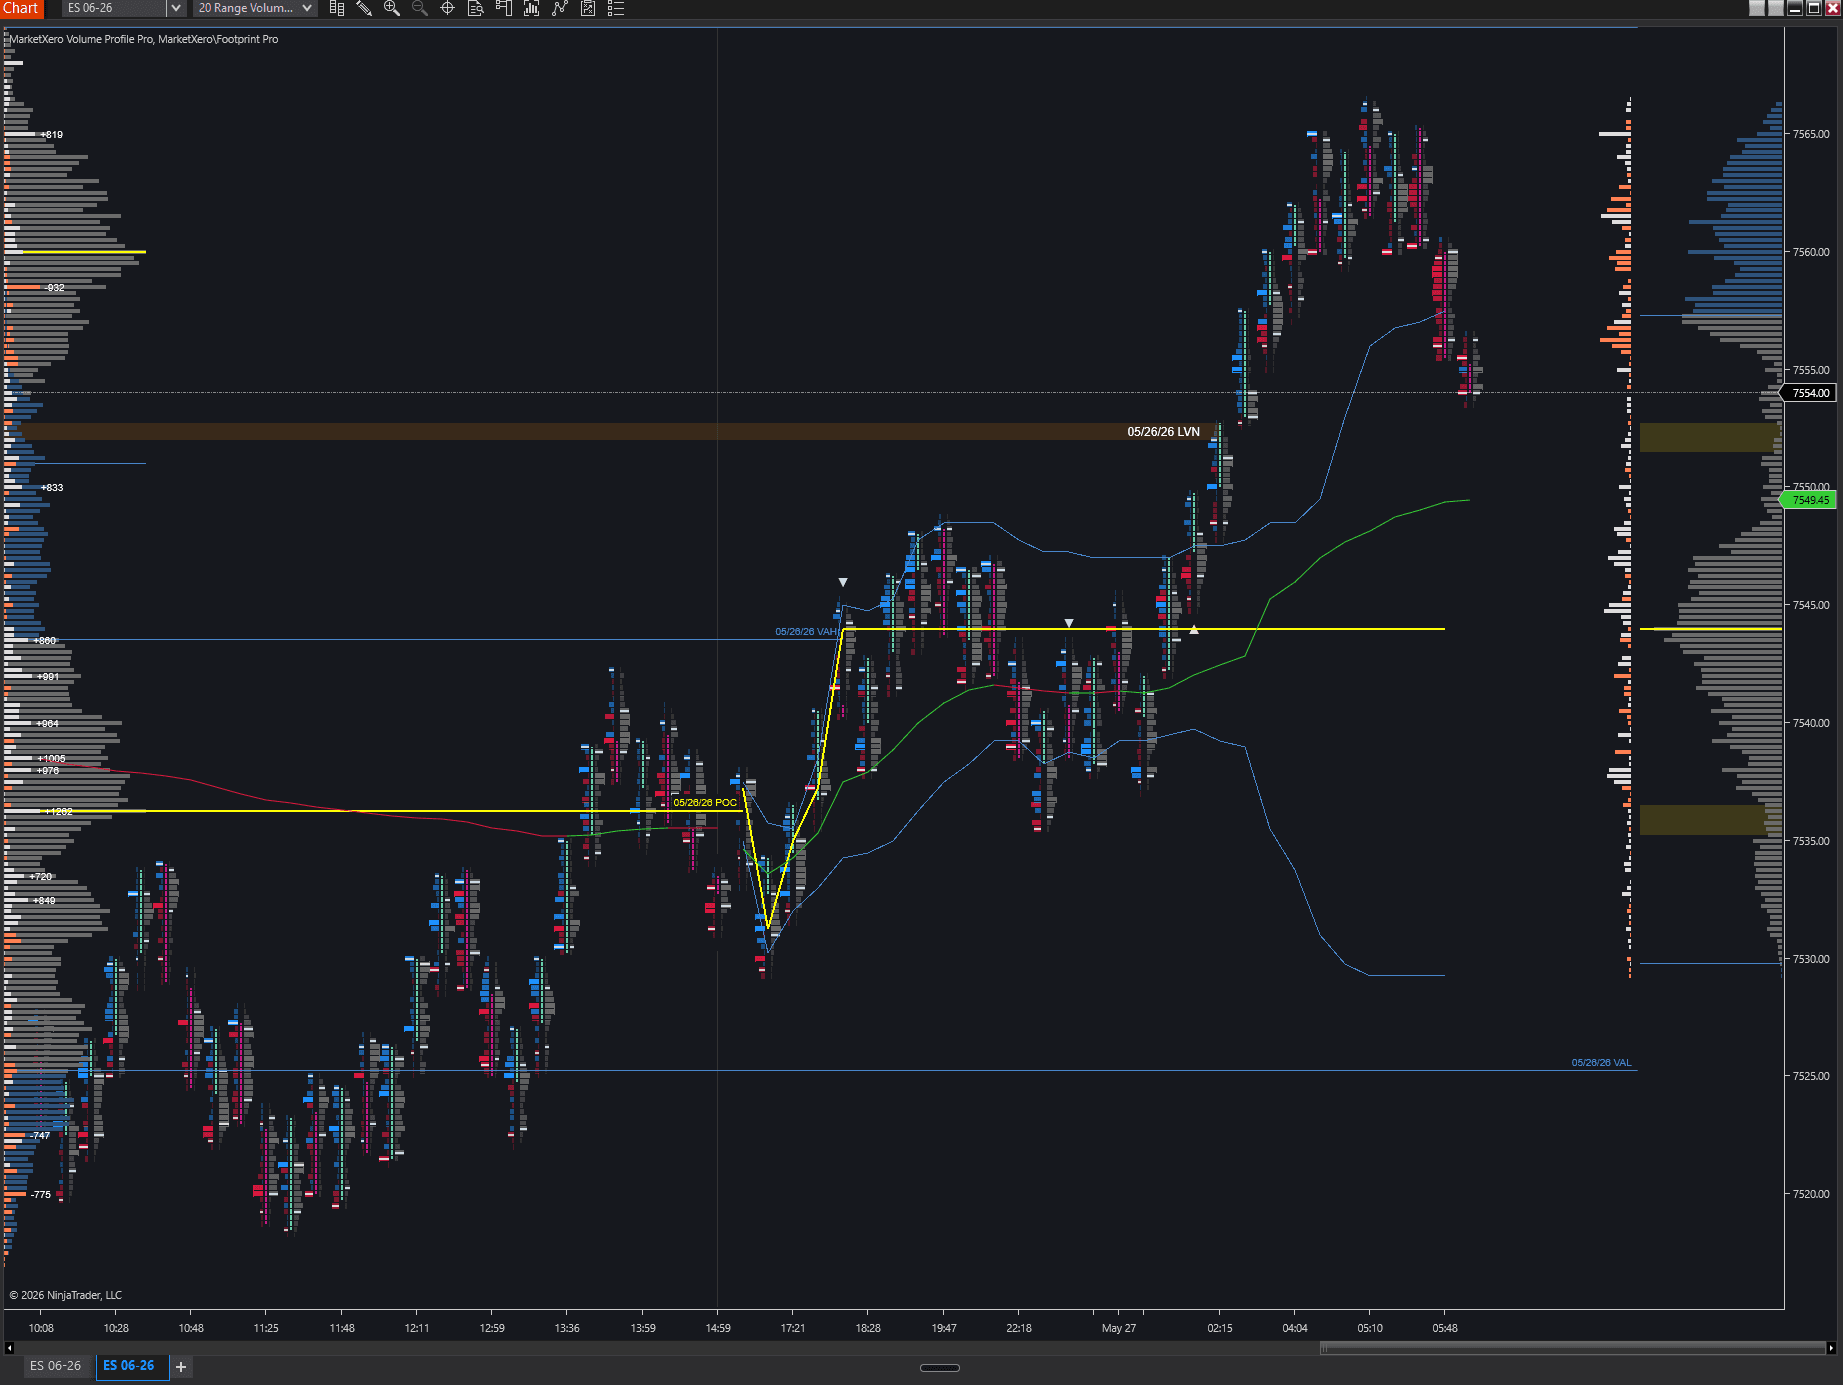
POC And Value Area
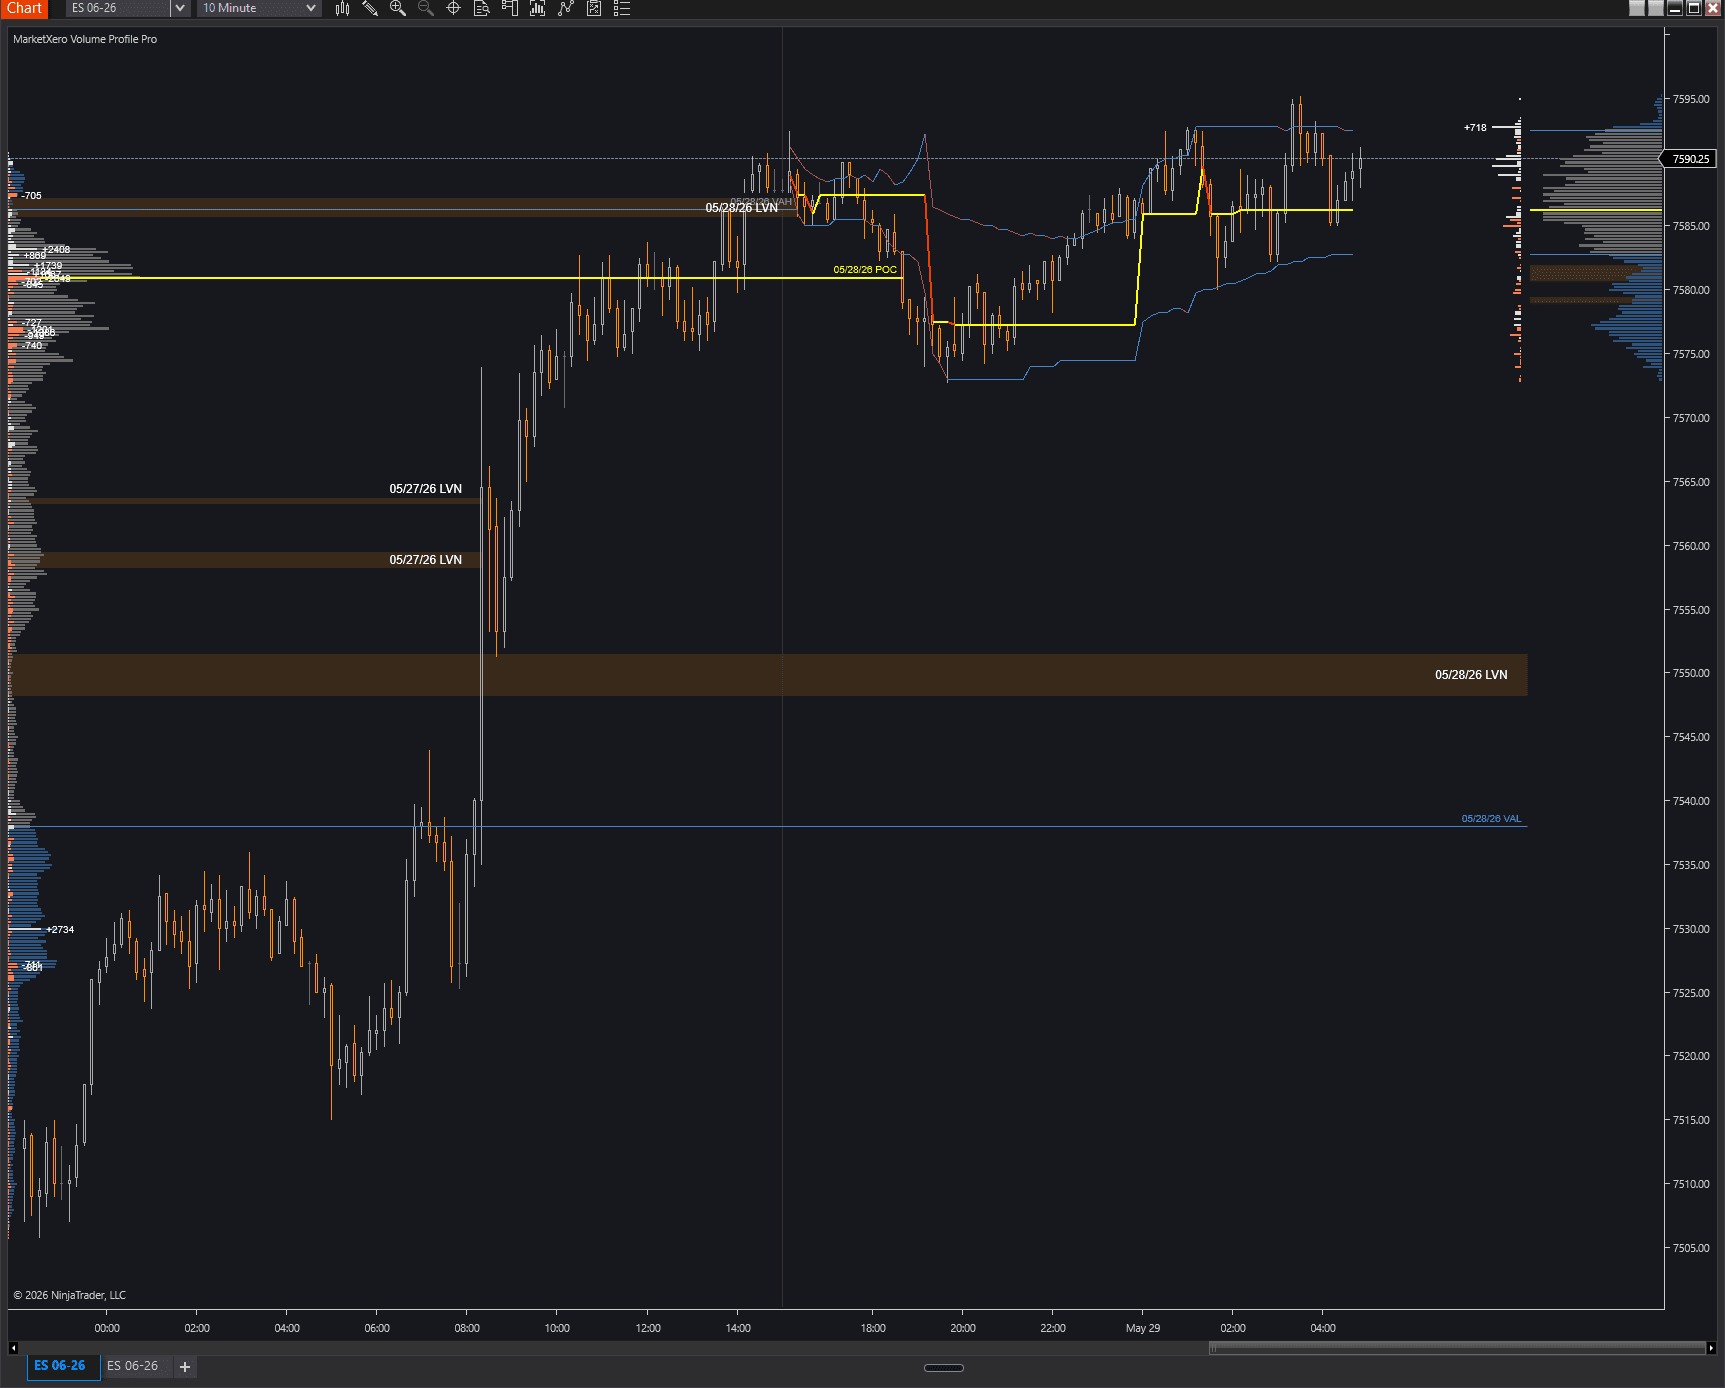
POC, VAH, and VAL are the primary profile references. Use them to decide where price is accepted, where it is leaving value, and where retests matter.
- Value Area Percentage accepts 50 to 95 percent.
- Show All POCs draws the POC line.
- POC Color and POC Line Width control the POC style.
- Show All VAH/VAL Lines draws value area boundaries.
- VAH/VAL Line Color and VAH/VAL Line Width control value area boundaries.
- Extend Previous Day POC projects prior-session POC forward until current trade interacts with the level.
- Extend Previous Day VAH/VAL does the same for prior VAH and VAL.
- Previous day date labels can be enabled for POC and VAH/VAL extensions.
Value Migration Trails
Trail settings draw how value changes during the session rather than only where it finished.
- Show POC Trail connects POC values at each bar close.
- Show VAH Trail and Show VAL Trail do the same for value area boundaries.
- Each trail has up color, down color, directional-color toggle, width, dash style, and opacity.
- Directional coloring makes rising value and falling value easier to separate.
- Use trails when the day is developing and you need to see value migrate higher, lower, or stay balanced.
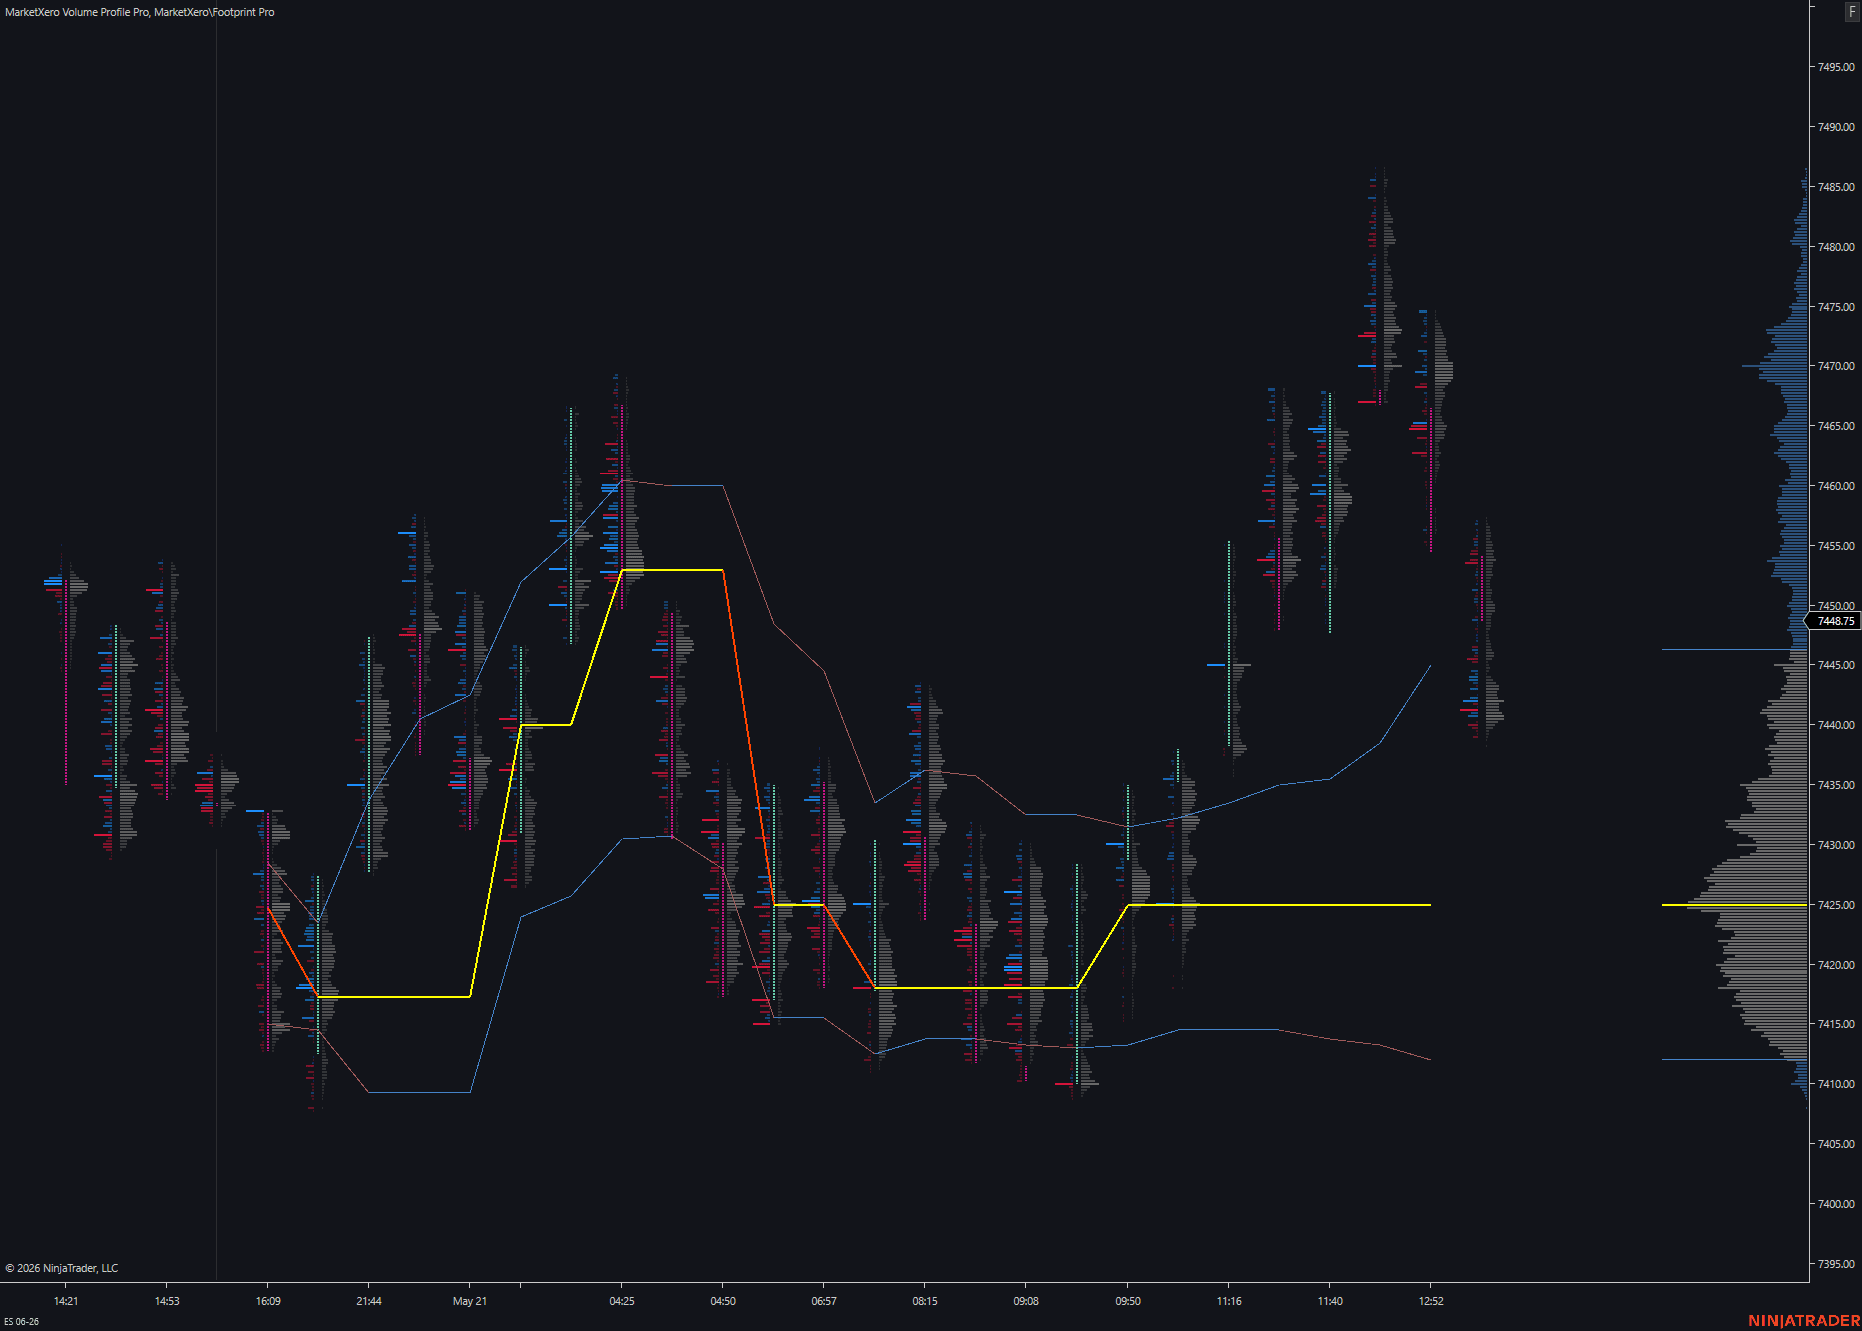
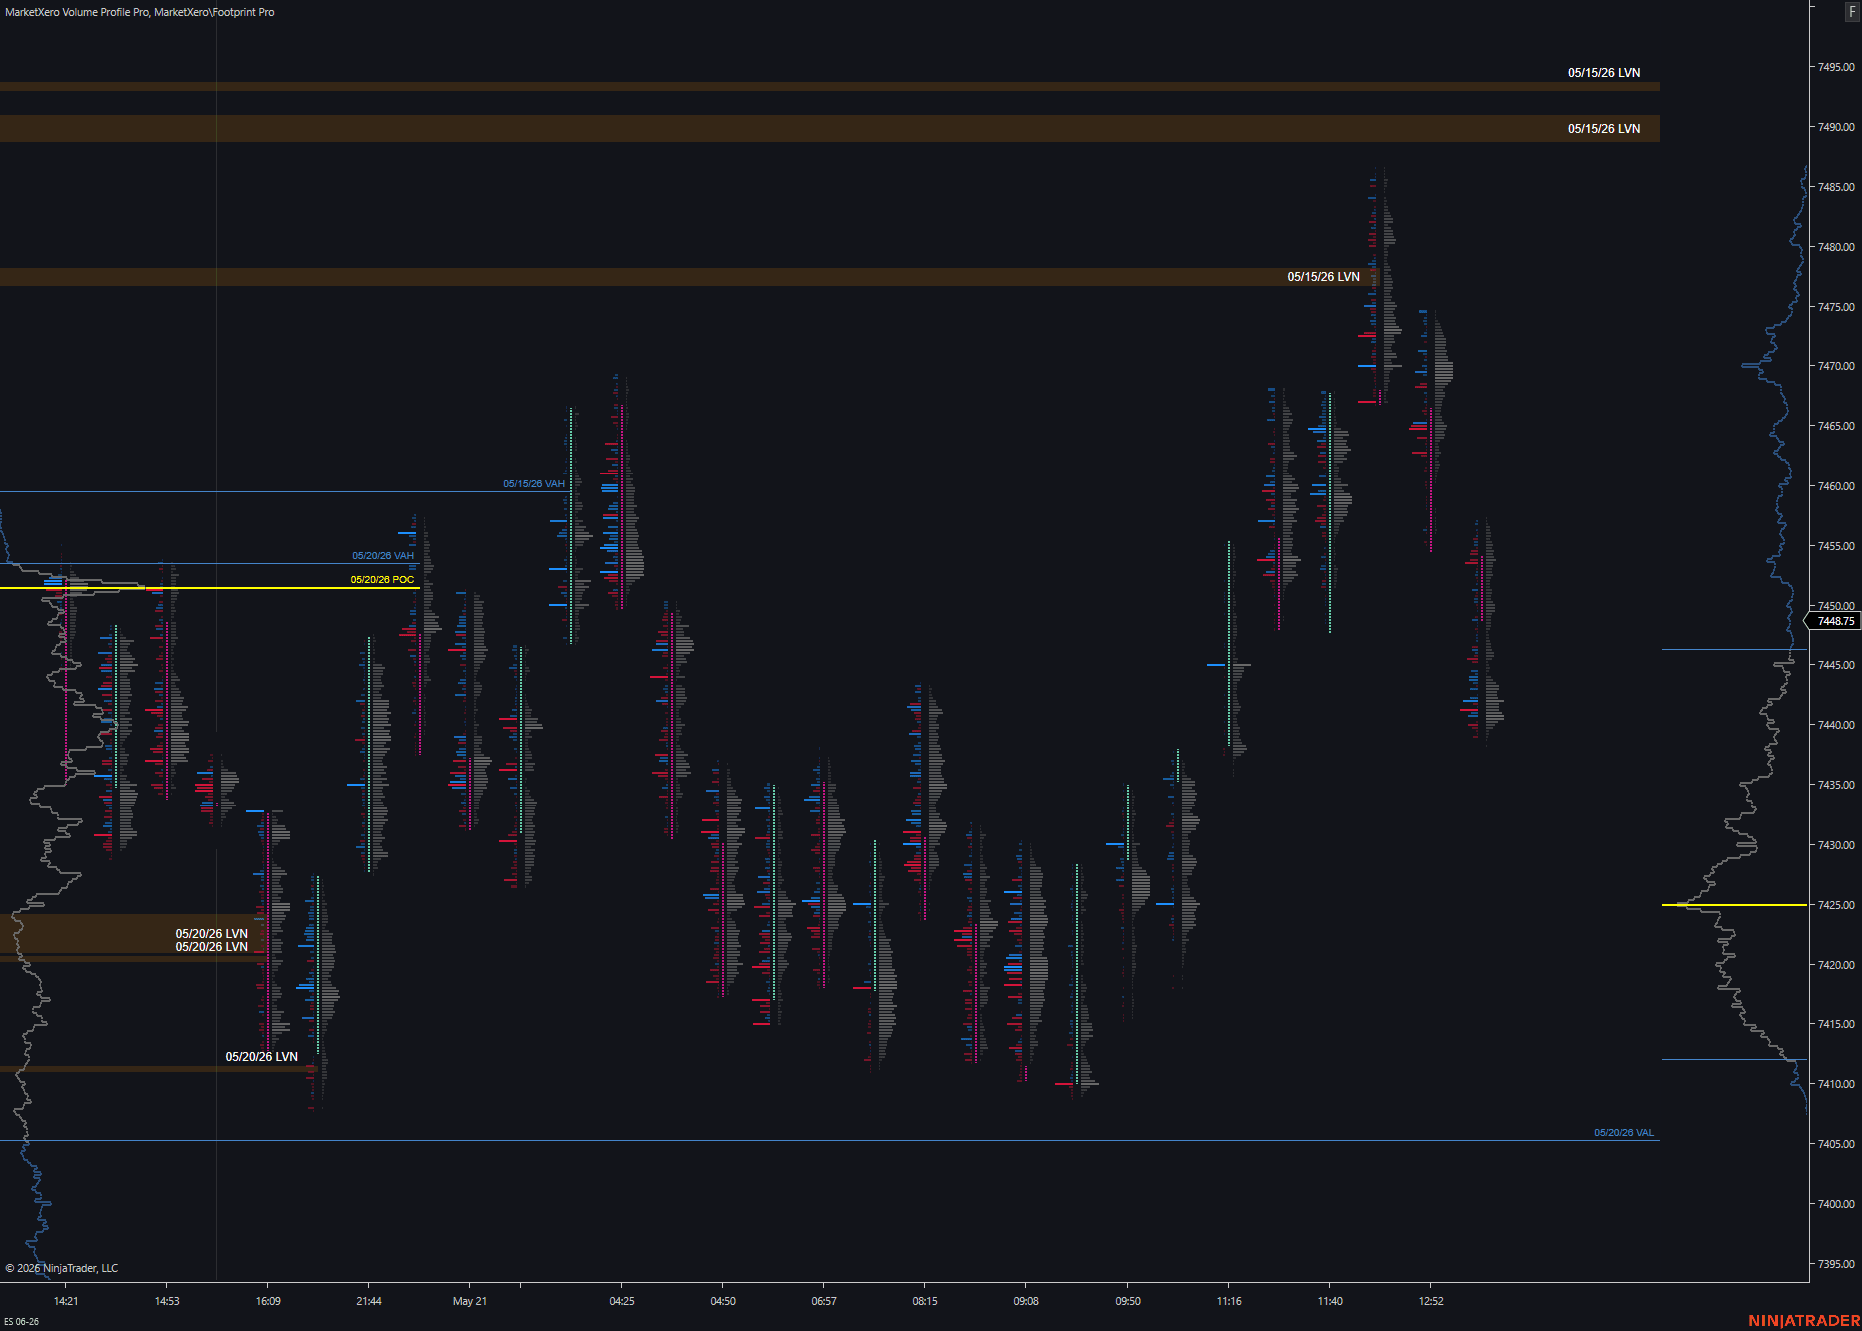
Delta Profile
Delta Profile adds direction to the volume-by-price map.
- Show Delta Profile enables bid/ask dominance by price.
- Bid Color is used where bid volume exceeds ask volume.
- Ask Color is used where ask volume exceeds bid volume.
- Delta Layout can overlay delta on the volume profile or split Total | Delta and Delta | Total.
- Show Delta Labels and Minimum Volume for Delta Labels control whether delta values print on the chart.
- Delta Label Position controls where labels sit relative to the delta bars.
- Previous-day delta profile and labels can be shown separately.
LVN Zones
Low Volume Nodes mark price areas where little business occurred relative to surrounding prices. They are often watched for rejection, fast traversal, or unfinished auction behavior.
- LVN Sensitivity ranges from defensive to aggressive detection.
- Ignore Session High/Low LVNs excludes LVNs that touch the session extreme.
- Current LVN color, opacity, border color, and border width control same-day zones.
- Show Previous Day LVNs projects prior-session LVNs across the current chart.
- Previous Day LVN color, opacity, border, and date-label settings control carry-forward zones.
- LVN preset debug controls can adjust threshold delta, minimum bars, median filtering, and merge ticks when troubleshooting detection behavior.
Trend Label And Diagnostics
The profile can display a regime label and debug output for production troubleshooting.
- Show Trend Label displays market regime classification on the chart.
- Trend Label Position controls the chart corner.
- Regime settings include recalc seconds, developing ATR multiple, developing volume percentage of daily average, and previous-level tolerance.
- Enable Debug Logging prints cache, session, and render-scope information.
- Enable Validation Debug prints license validation and chart-type diagnostics.
- Enable Volume Audit Debug compares primary chart volume to the volumetric series aggregate.
FAQ
Short answers for setup and first-use questions.
Should I use RTH or Full Session?
Use RTH when you care about the main cash-index session. Use Full Session when overnight acceptance and Globex structure are part of your plan.
What does Structural POC Mode do?
It excludes the closing bar from POC and value area calculation so a closing spike does not distort the structural references.
Why am I seeing too many or too few LVNs?
Start with LVN Sensitivity and Ignore Session High/Low LVNs. Use debug overrides only when you are intentionally tuning the preset behavior.