
Risk Manager Help
Demand/supply zones, BOS, CHoCH, market structure on a dedicated timeframe, the floating add-on, entry source and mode, scale-in sizing, stop, target, and max-risk reference.
Use Risk Manager when a planned zone or structure level needs to become a sized trade: entry source, entry mode, stop buffer, target, fees, max dollar risk, scale-in, and contract count.
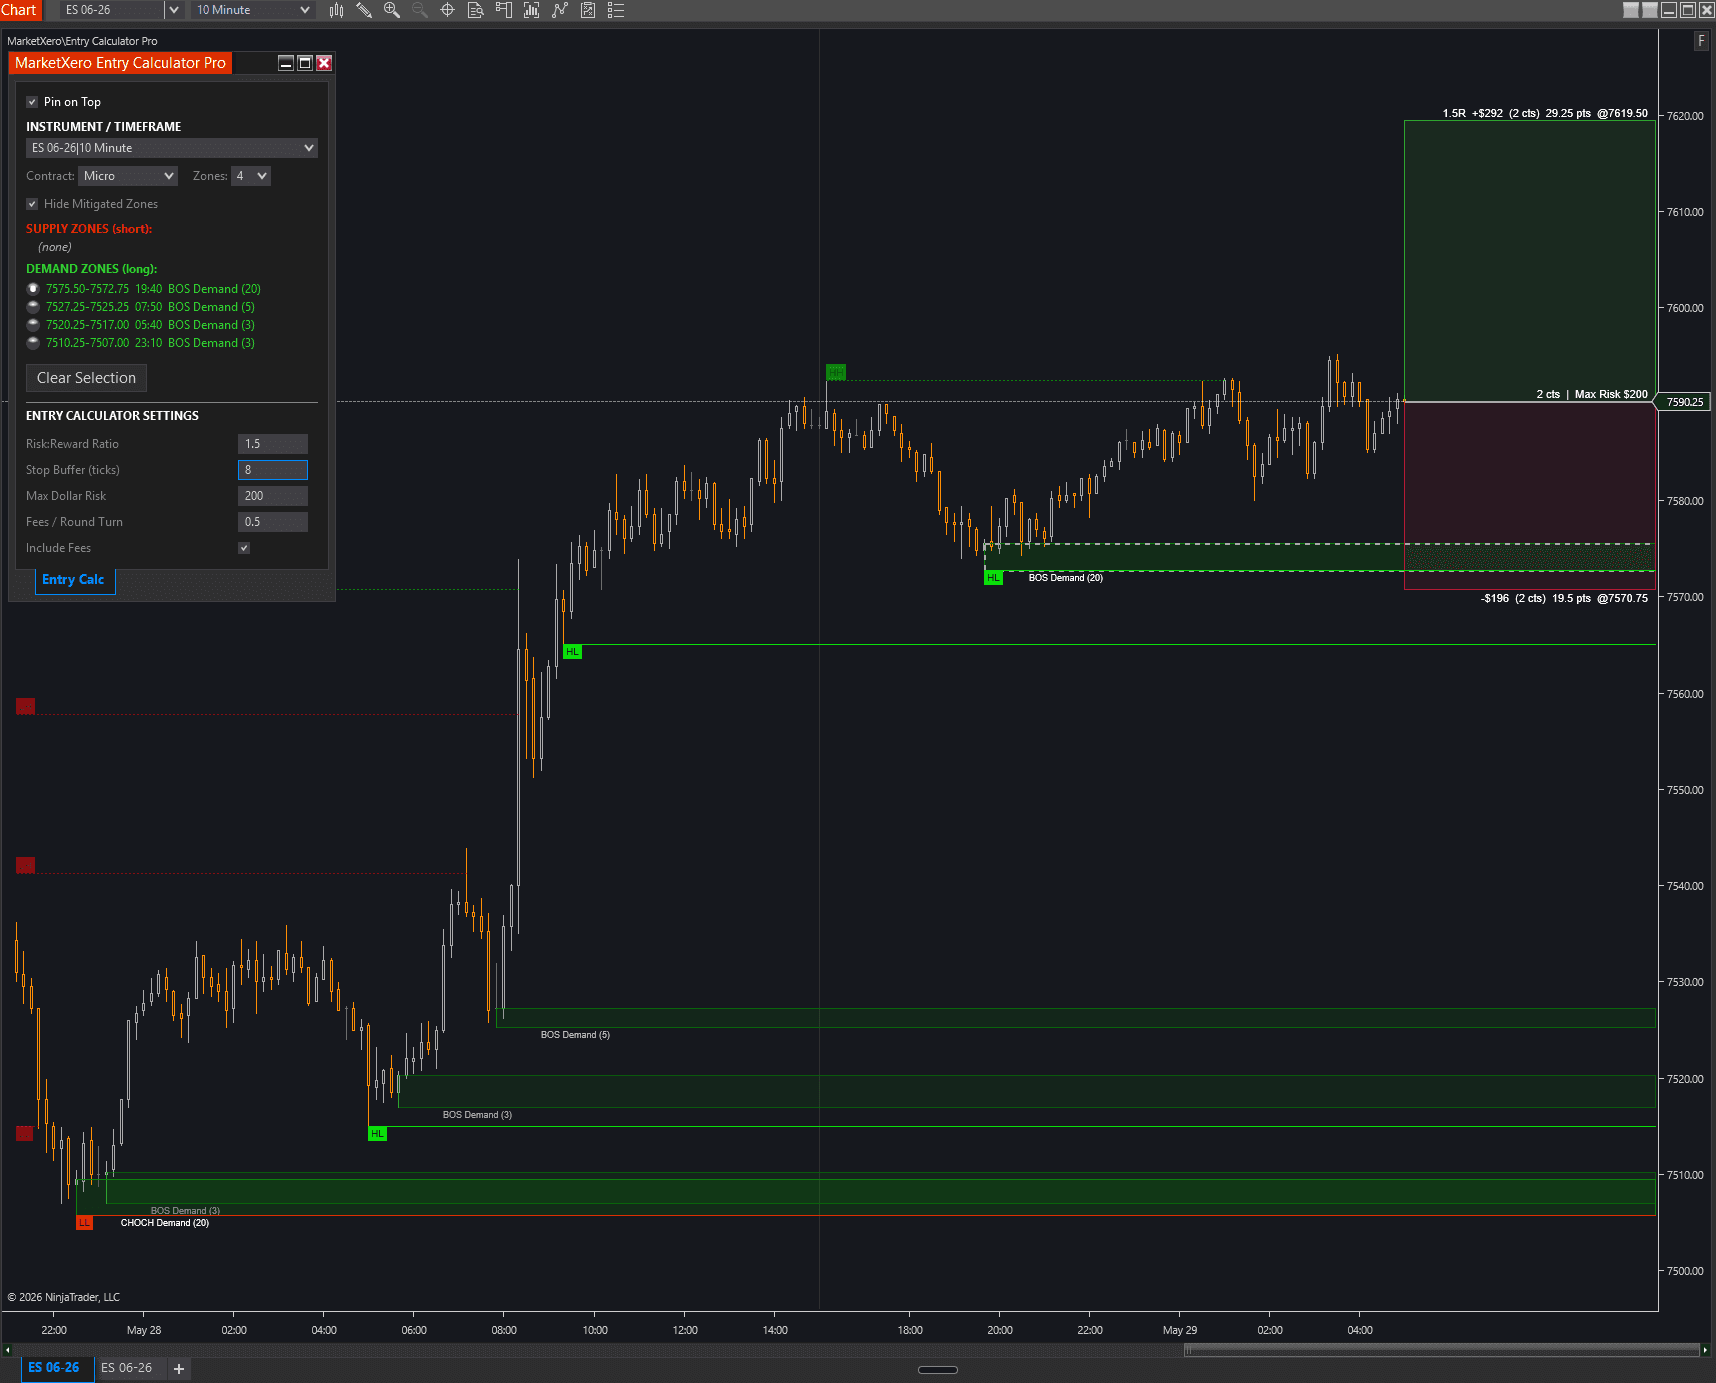
What It Shows
Risk Manager is made from two pieces: the chart indicator and the floating add-on.
- The chart indicator identifies BOS and CHoCH demand and supply zones.
- It draws HH, HL, LH, and LL market-structure lines and labels on a dedicated structure timeframe, independent of the chart timeframe.
- It publishes active zones and structure swings to the floating MarketXero Risk Manager add-on.
- The add-on lets you pick a demand/supply zone or a structure level, and choose how the entry is placed, without clicking around the chart.
- The indicator renders entry, stop, target, risk, reward, R:R, and contract count on the chart, with a corner risk table.
- Contract size is calculated from max dollar risk and risk per contract, and can scale in up to a max-contracts cap.
Chart Indicator Setup
Add MarketXero\Risk Manager to the chart first. The indicator now installs under the MarketXero folder and appears as MarketXero Risk Manager in the indicator picker.
- It works on standard chart types including minute, daily, range, tick, and others.
- Show Tick Replay should remain unchecked in NinjaTrader market data settings.
- Show BOS Zones and Show CHOCH Zones control which zone types are plotted.
- Show Zone Labels and Zone Label Right Offset (pixels) control label placement.
- Hide Mitigated Zones removes zones after mitigation when you want a cleaner live chart.
- Zone Opacity, Zone Border Width, and Zone Border Style control active-zone fill and outline, with separate mitigated-zone styling.
Naming note
Older installs may show this indicator as Entry Calculator Pro. It is the same tool, renamed to MarketXero Risk Manager; reimport the latest version to pick up the new name.
Zones And Borders
Zones are created from Break of Structure and Change of Character context and drawn as demand or supply boxes you can trade from.
- Show BOS Zones and Show CHOCH Zones choose which break types are plotted.
- Demand, supply, mitigated-demand, and mitigated-supply zones each have an independent color.
- Zone Opacity sets the active-zone fill strength; Zone Border Width and Zone Border Style set the outline.
- Mitigated Zone Opacity, Mitigated Zone Border Width, and Mitigated Zone Border Style style zones after they are mitigated.
- Hide Mitigated Zones removes cleared zones entirely for a cleaner live chart.
- Zone Label Right Offset (pixels) nudges the demand and supply labels clear of recent price action.
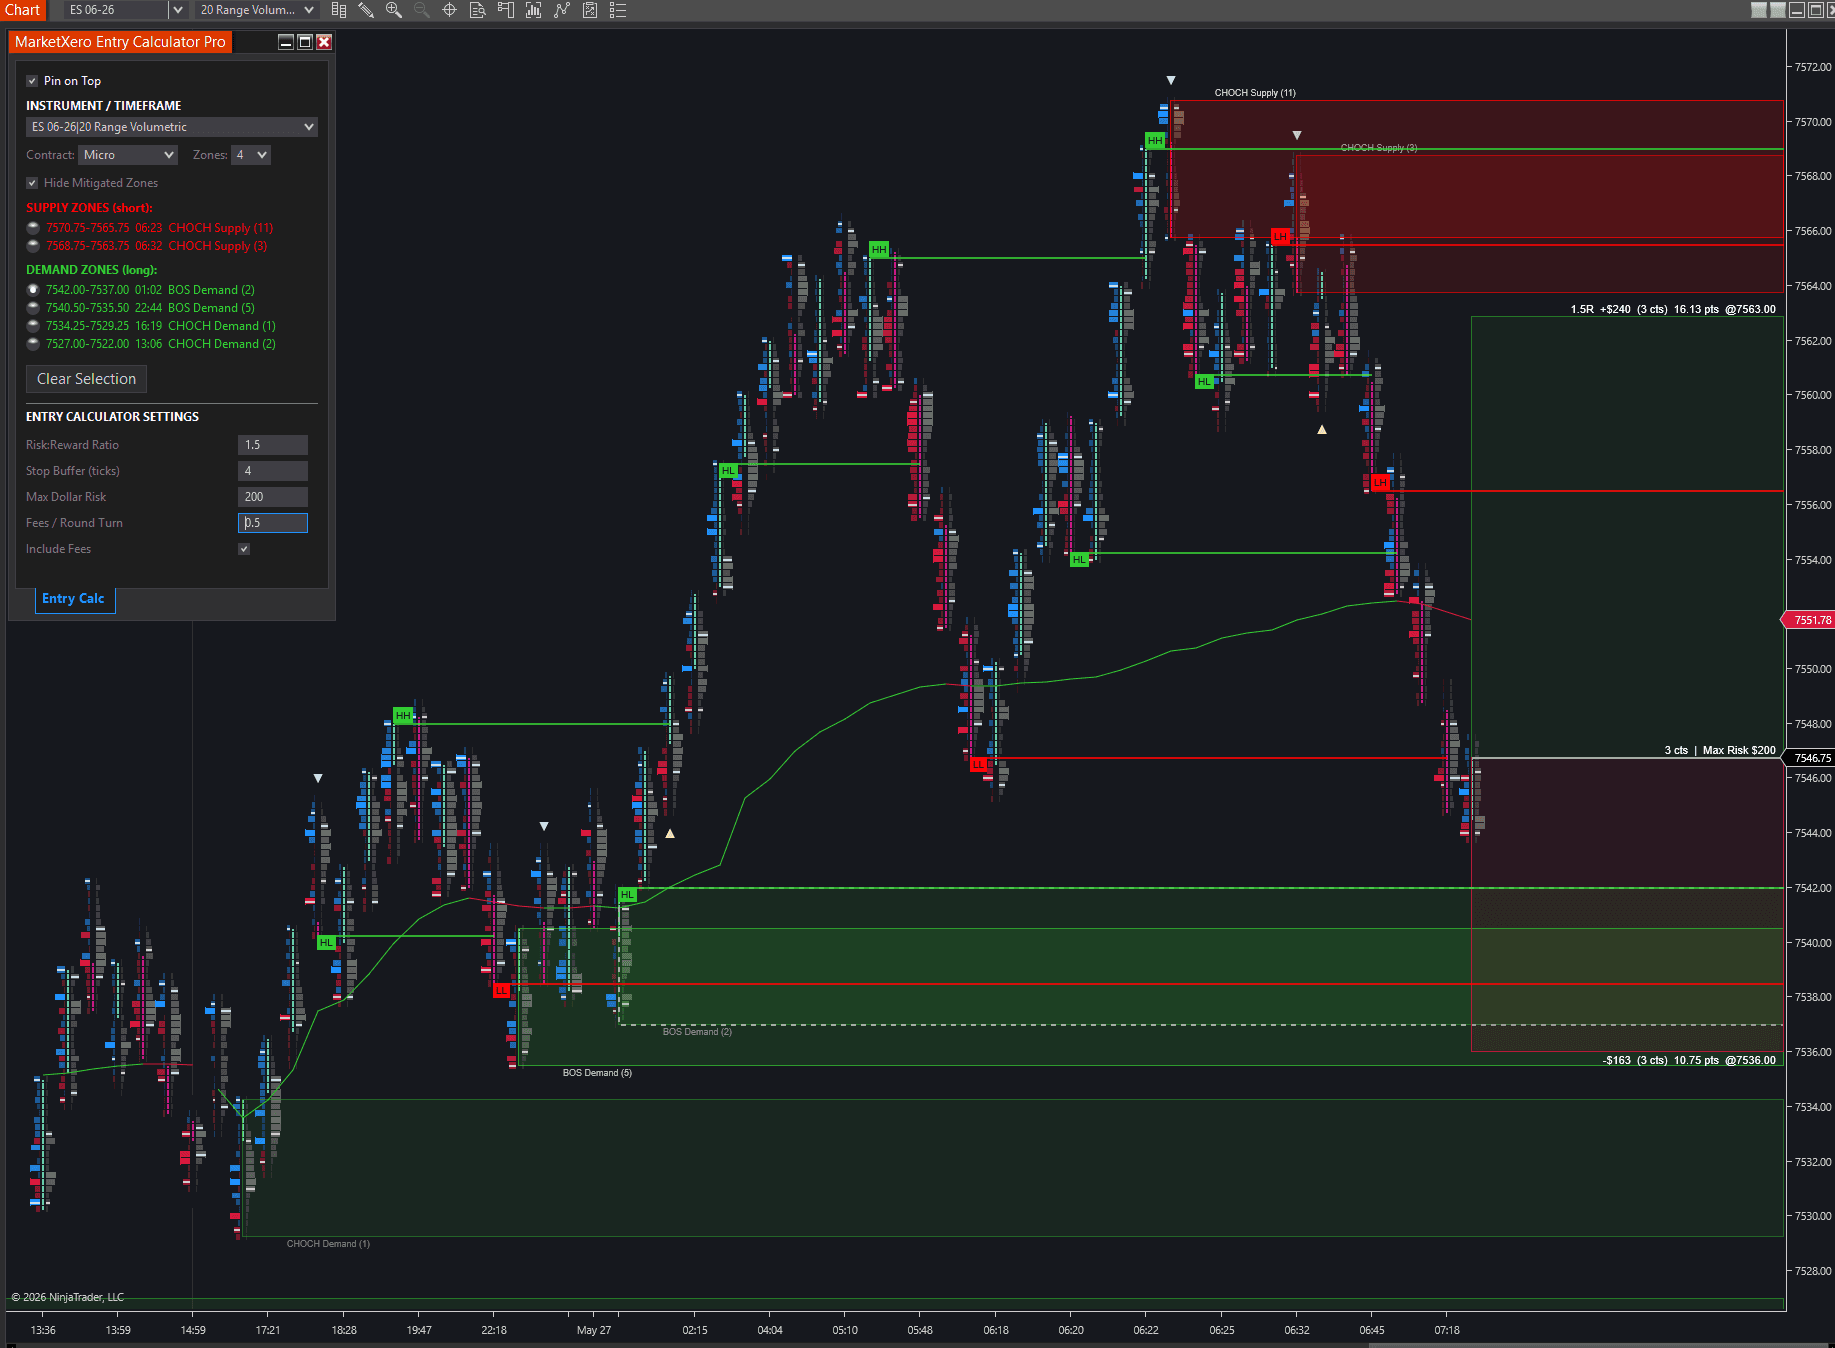
Market Structure Lines
Market structure lines give the zone context without making the trader infer every swing by eye.
- Structure Timeframe computes structure on its own dedicated data series, independent of the chart timeframe, and defaults to 5 Minute.
- Show Market Structure draws confirmed HH, HL, LH, and LL levels; Show Structure Lines and Show Structure Labels control what is drawn.
- Swing Sensitivity (ATR multiple) sets how far price must retrace from the running extreme, in ATRs of the structure timeframe, before a swing is confirmed. Higher values mean fewer, larger swings.
- Require Close Beyond Level uses closes instead of wicks for new extremes and line breaks.
- Bullish Structure Color controls HH and HL lines; Bearish Structure Color controls LH and LL lines; Line Opacity and Line Weight style them.
- Show Prior Session-Day Structure keeps or hides older session-day structure.
- Mitigated Structure Display can keep full color, dim lines (with Mitigated Line Opacity and Style), or hide broken structure.
Floating Add-On
Open the add-on from NinjaTrader Control Center: New -> MarketXero Risk Manager.
- Instrument / Timeframe selects the chart bridge the add-on should read.
- Entry Source switches the lists between Zones (demand/supply) and Structure (high/low swings); supply or high structure is listed for shorts, demand or low structure for longs.
- Entry Mode chooses At Level (rest the order at the zone or level) or At Market (size from the current price).
- Zone Entry Buffer (ticks) and Structural Entry Buffer (ticks) offset the entry from the zone edge or structure level.
- R:R Ratio, Max Dollar Risk, Include Fees, Fees / Round Turn, and Stop Buffer (ticks) drive the calculation and override the chart settings while the add-on is active.
- Show Scale-in Levels and Max Contracts control the scale-in ladder.
- Table Corner positions the on-chart risk table; Structure TF (refresh) drives the indicator's structure timeframe.
- Clear Selection removes the active selection, and add-on settings persist through NinjaTrader workspace save and restore.
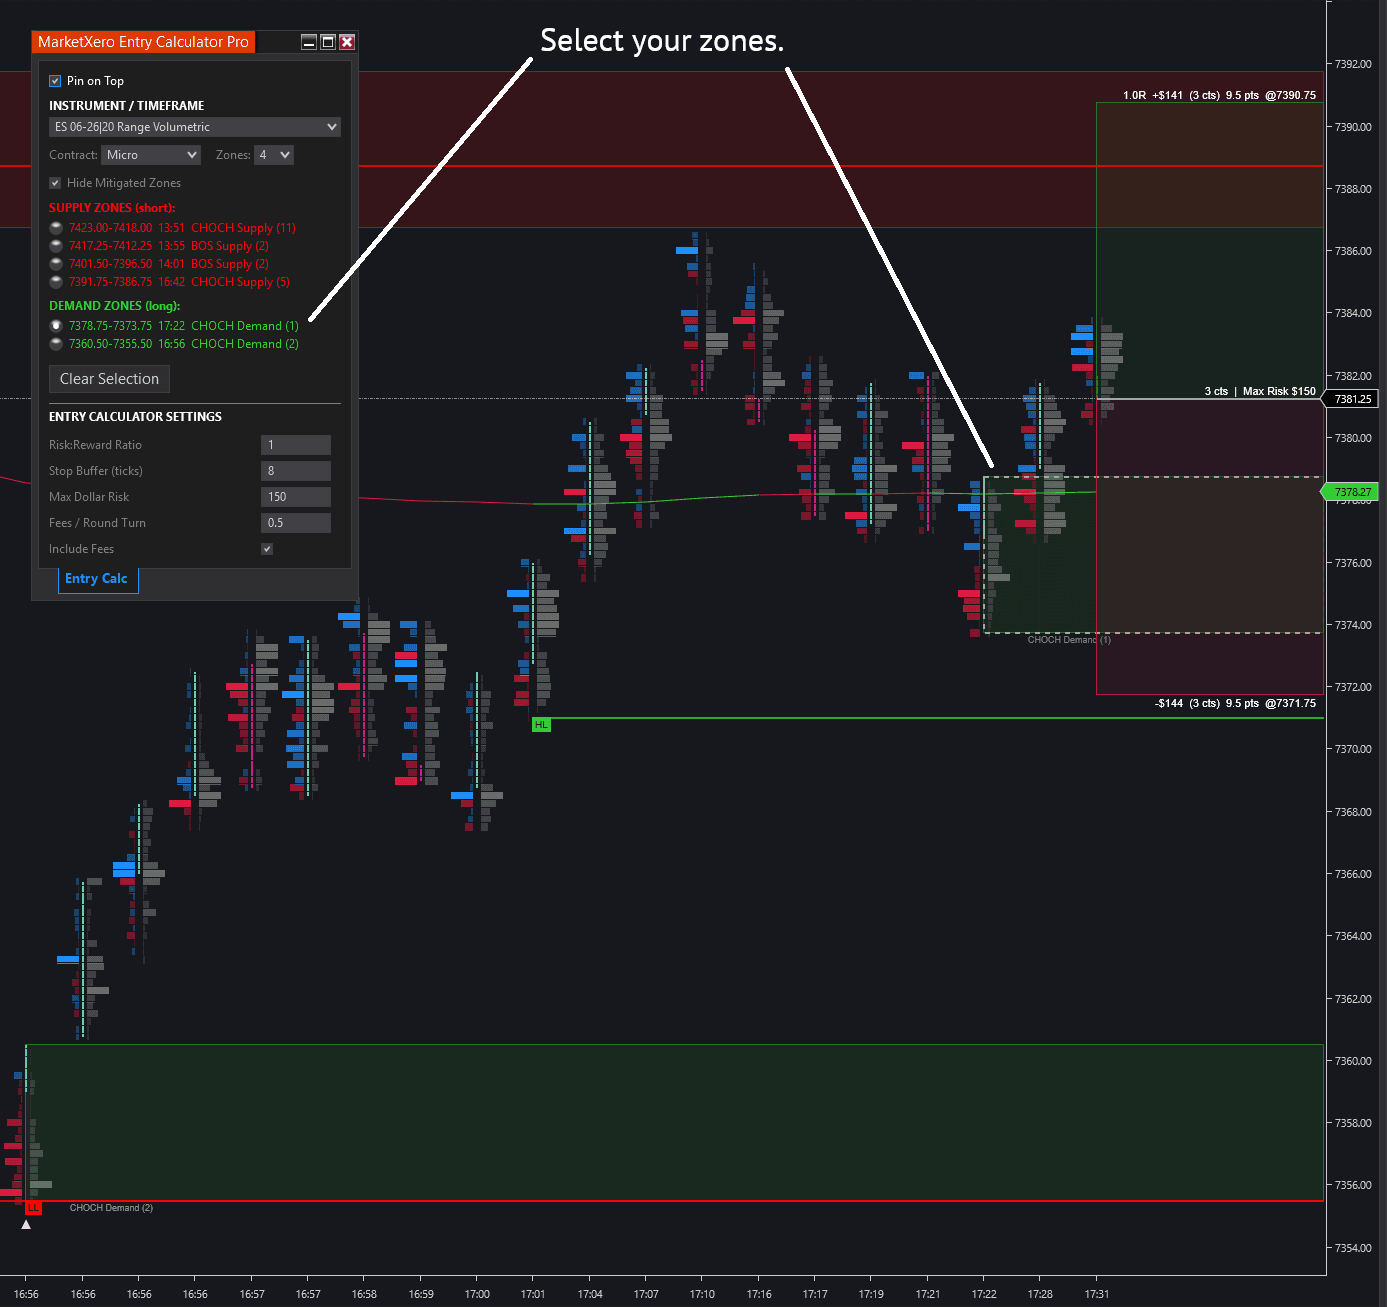
Risk Math
The calculator converts the selected zone or structure level into a planned trade.
- Entry comes from the selection and the Entry Mode: At Level uses the zone or structure level (plus the entry buffer), while At Market uses the current price.
- Stop is placed beyond the zone boundary or structure level plus Stop Buffer ticks.
- Target is calculated from the resolved Risk:Reward Ratio.
- Max Dollar Risk caps the trade size, and contract auto-sizing uses floor(MaxDollarRisk / riskPerContract).
- Scale-in ladders in additional contracts as the account can afford them within Max Dollar Risk, up to the Max Contracts cap.
- Include Fees and Fees per Round Turn can add fees to the calculation.
- Add-on overrides take precedence over chart indicator settings when the add-on is active.
- When one-contract risk exceeds Max Dollar Risk, contracts become 0 and the chart uses the over-max visual state.
Trade Plan Display
The chart display makes the trade plan visible before the order goes in.
- Entry, stop, and target draw as lines; Show Entry Label, Show Stop Loss Label, and Show Profit Target Label toggle each line's label.
- A corner risk table summarizes entry, stop, target, risk, reward, and contracts; its corner is set by Table Corner in the add-on.
- Profit Target Color/Opacity and Stop Loss Color/Opacity style the target and stop zones; Entry Line Color styles the entry line; Label Font Size controls the labels.
- Over-Max Stop Loss and Over-Max Profit Target colors replace normal fills when risk exceeds the max-dollar rule.
- The selected source zone or structure level gets a dashed highlight so the trade plan can be traced back to it.
Trading Workflow
Risk Manager is meant to slow the sizing decision down before the click.
- Load the chart indicator and confirm current demand and supply zones, and market structure, are visible.
- Open the add-on when you want a floating selector instead of chart-only settings.
- Set Entry Source (Zones or Structure) and Entry Mode (At Level or At Market), then select the zone or structure level that matches your setup.
- Confirm stop buffer, R:R, max dollar risk, fees, and your Max Contracts scale-in cap.
- Check the corner risk table for contracts, risk dollars, reward dollars, stop points, and target points.
- If the over-max state appears, reduce size, adjust the plan, or skip the trade.
FAQ
Short answers for setup and first-use questions.
My install says Entry Calculator Pro. Is that the same thing?
Yes. The indicator and add-on were renamed to MarketXero Risk Manager. Older installs may still show the Entry Calculator Pro name; reimport the latest version and it will appear as MarketXero Risk Manager under the MarketXero folder.
Do I have to use the floating add-on?
No. The chart indicator has settings, but the add-on is the faster workflow for choosing active zones and overriding risk settings while trading.
Why does it show zero contracts?
That means one-contract risk is greater than the configured Max Dollar Risk. The over-max state is intentional, not a rendering failure.