
Footprint Help
Bid/ask, delta, imbalance, zero print, POC, value area, and non-volumetric mode reference for MX-Footprint.
Use Footprint when the trade decision depends on what happened inside the bar: who hit bid, who lifted offer, where size concentrated, and whether price accepted that aggression.
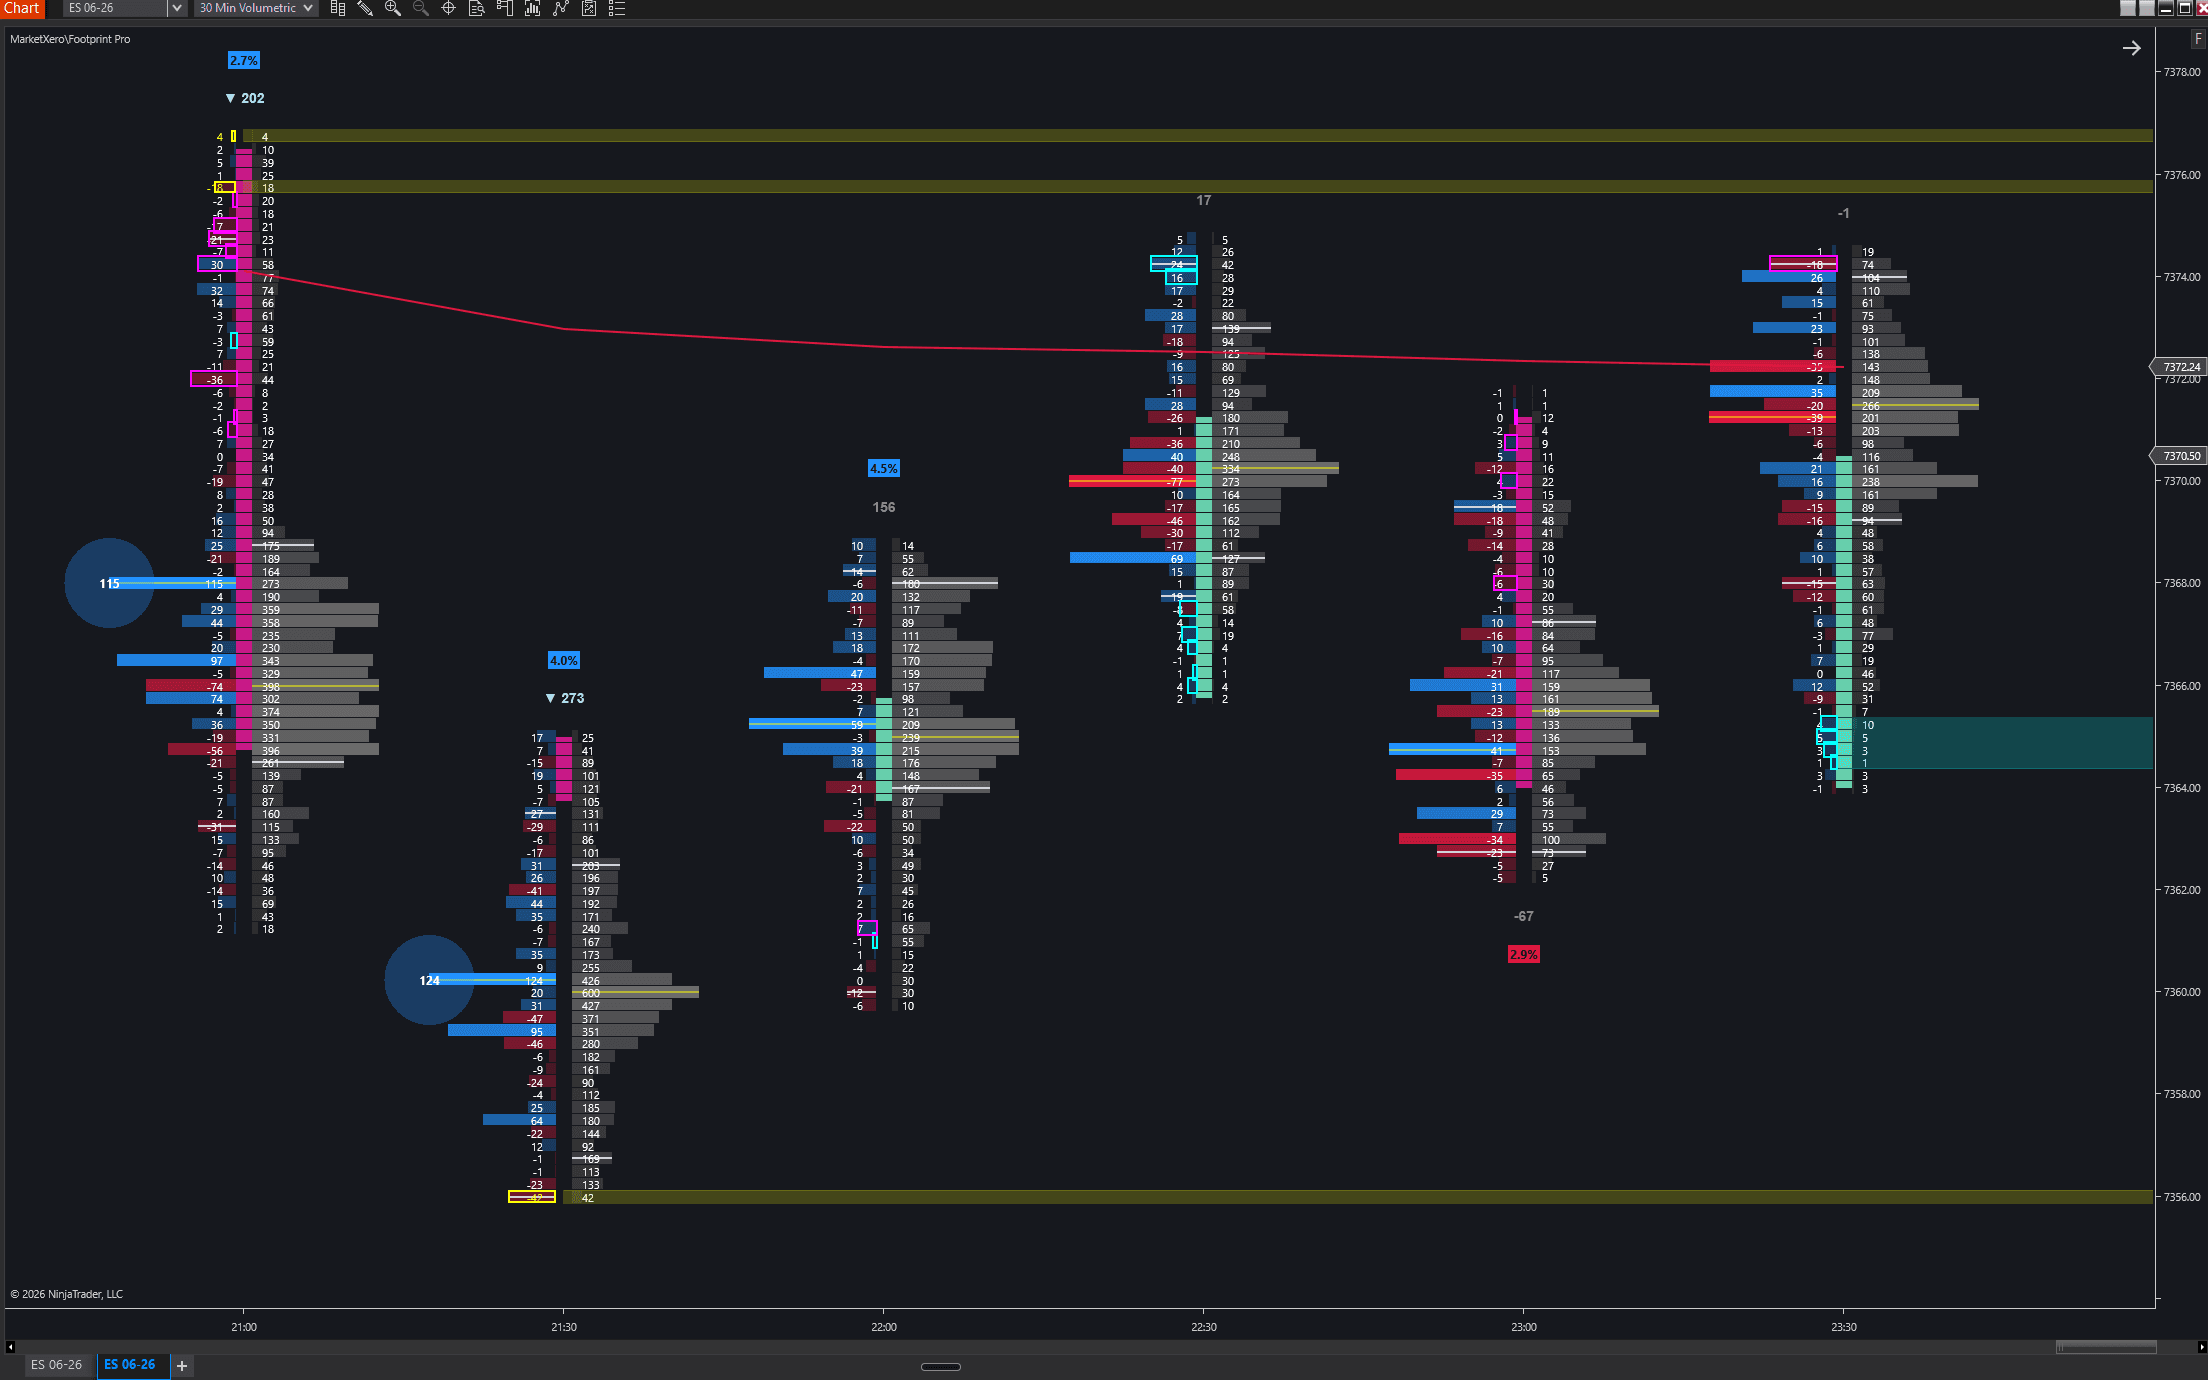
What It Shows
Footprint is the execution read. It turns each bar into a price-by-price auction view so the chart shows volume, delta, imbalance, POC, value area, zero prints, and threshold bubbles without leaving NinjaTrader.
- Display Mode controls the two primary columns: Delta | Total or Bid | Ask.
- Delta is ask volume minus bid volume. Total is bid plus ask.
- The indicator can highlight POC by bid, ask, delta, or total volume.
- Value area lines can be calculated from bid, ask, delta, or total distribution.
- Divergence and absorption labels show when delta fights the candle direction.
- Zero print and stacked imbalance zones can extend forward as future reaction areas.
- In NinjaTrader, the indicator installs under the MarketXero folder and appears as "MarketXero Footprint" in the indicator picker.
Chart Requirements
For the full per-price ladder, POC, value area, and zero prints, use a Volumetric chart. Non-volumetric charts now reach feature parity through an internal tick engine, with two intentional exceptions.
- On a Volumetric chart, keep NinjaTrader Tick Replay off. Native bid/ask volume is already available.
- On non-volumetric charts (time, tick, range, constant-volume, and similar bar types), also keep Tick Replay off. Footprint adds an internal 1-tick data series and classifies each tick against the prevailing bid/ask.
- Footprint detects non-volumetric charts automatically. There is no Non-Volumetric Mode setting to enable.
- The indicator warns you if Tick Replay is on, because Tick Replay on the primary chart is not used and can distort volume.
- Non-volumetric charts show delta divergence, zero prints, stacked volume imbalances, imbalance ticks, threshold bubbles, delta percentage, and delta change.
- Non-volumetric charts omit only the bid/ask and delta/total ladders and the POC, VAH, and VAL lines, which stay off there to reduce noise.
No Tick Replay required
Footprint no longer needs Tick Replay on non-volumetric charts. Keep Tick Replay off on every chart; the internal 1-tick engine handles bid/ask classification. If Tick Replay is on, turn it off to avoid distorted volume.
Display Modes
Start here before changing advanced signals. The display group controls what prints in the footprint columns and how much text remains visible when bars get narrow.
- Delta | Total: left column is delta, right column is total volume at that price.
- Bid | Ask: left column is bid volume, right column is ask volume.
- Compact Mode tightens the footprint so more bars fit on screen.
- Hide Left Text and Hide Right Text remove text while leaving the volume bars visible.
- Auto-Hide Text Threshold hides volume text when bar width drops below the selected pixel width.
- Font Size and Font Color should be set for contrast against the chart background and volume bar colors.
- Use Dynamic Opacity makes lower-volume price levels more transparent while the highest-volume level stays fully visible.
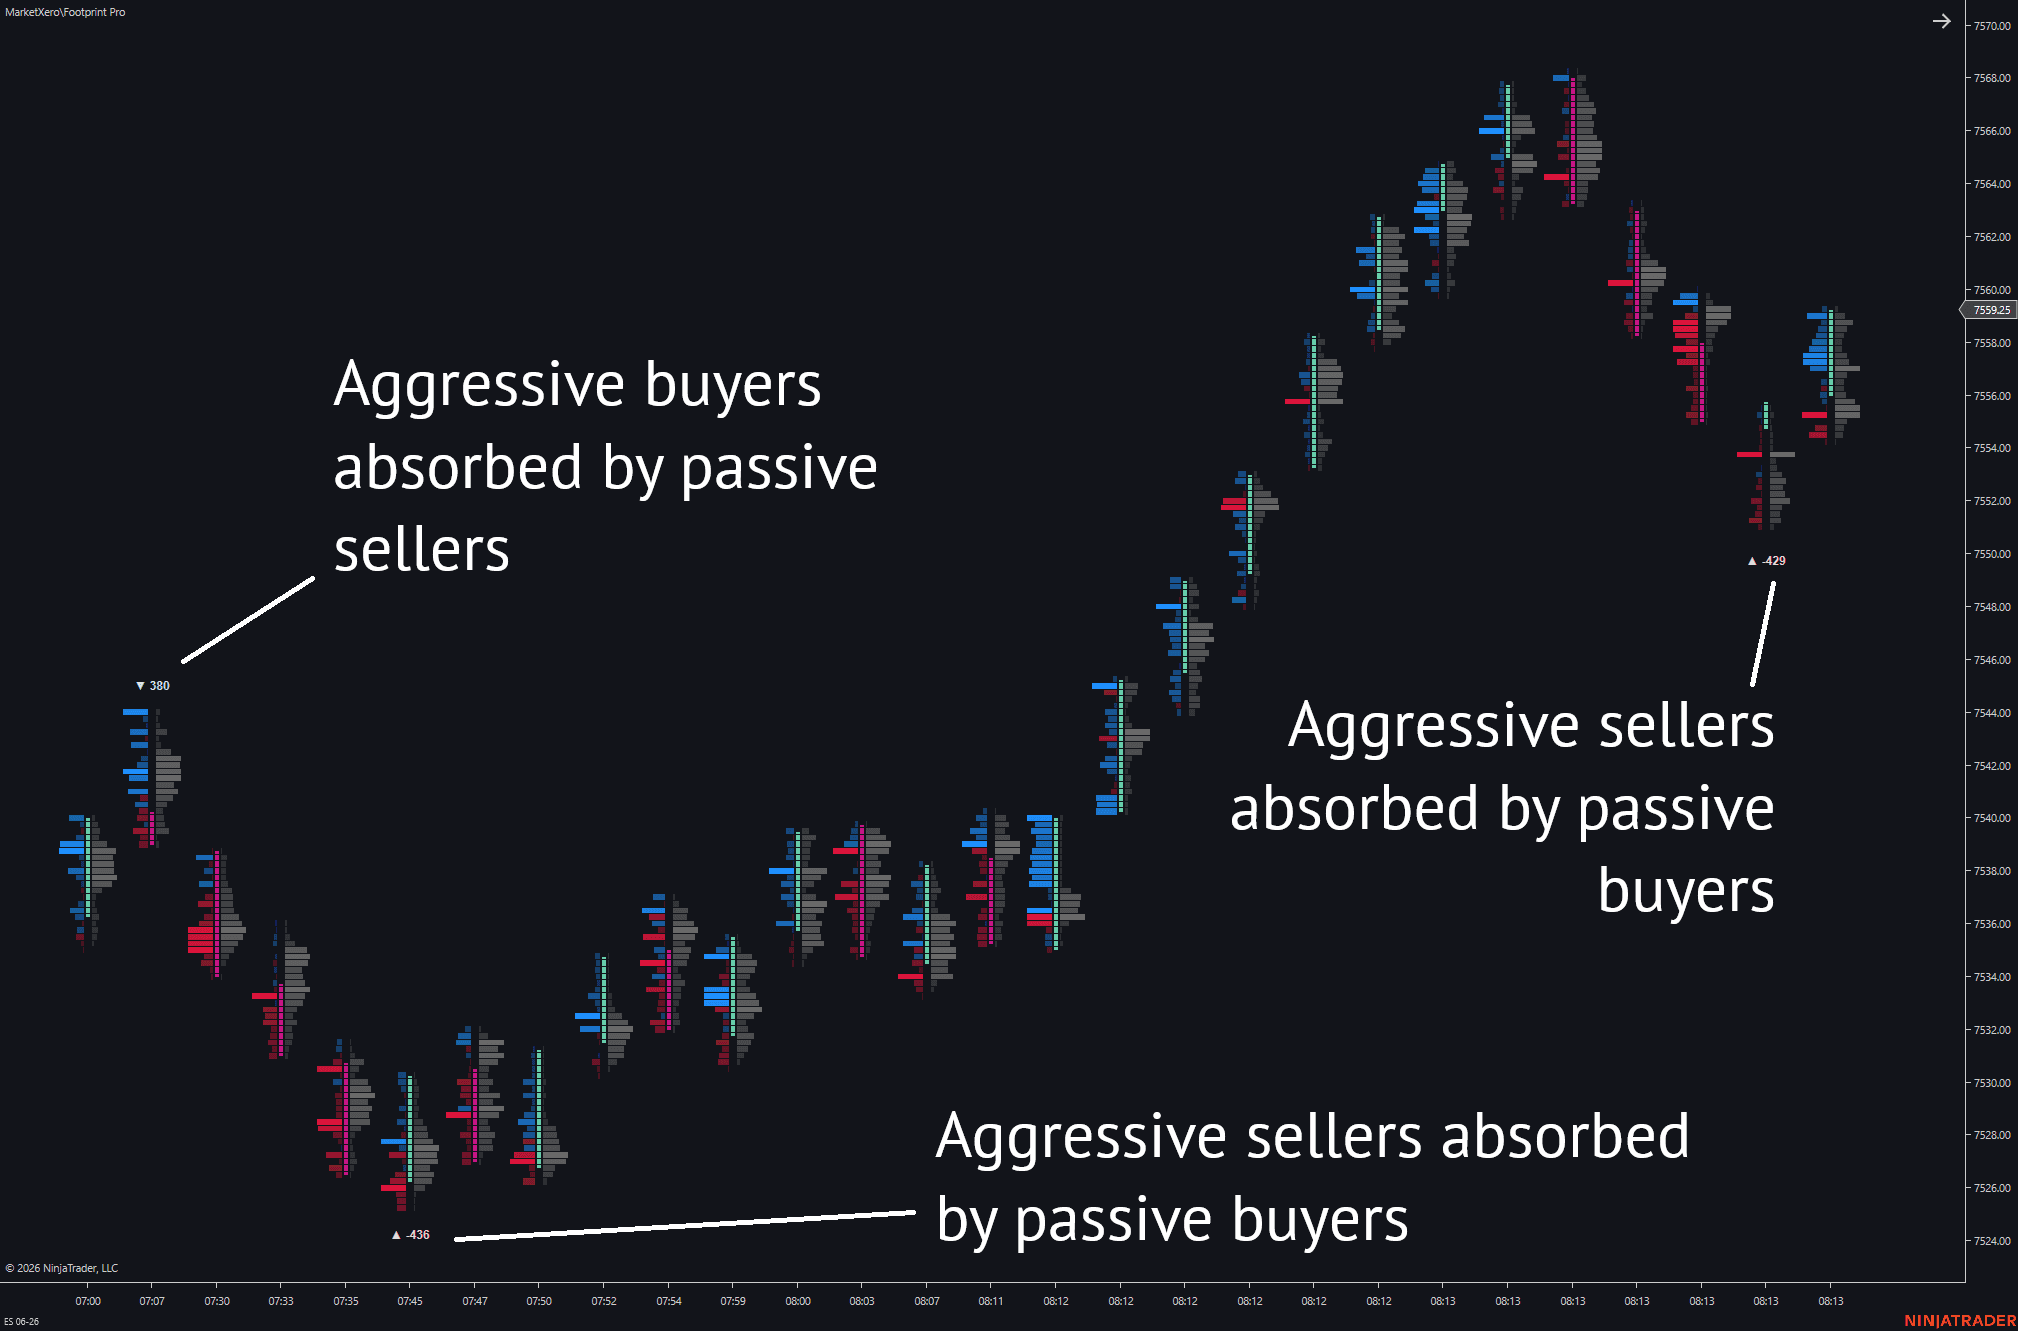
Delta Divergence
Divergence marks absorption: aggressive volume is leaning one way while the candle closes the other way.
- Show Divergence Icon draws directional markers on divergence bars.
- Absorbed buyer color is used when aggressive buyers are absorbed into a bearish candle.
- Absorbed seller color is used when aggressive sellers are absorbed into a bullish candle.
- Min Divergence Value filters out low-volume delta flips.
- Divergence Font Size and Text Distance to FP Bar control label readability.
- Neutral Delta Text Color applies when all delta is shown and the bar is not a divergence bar.
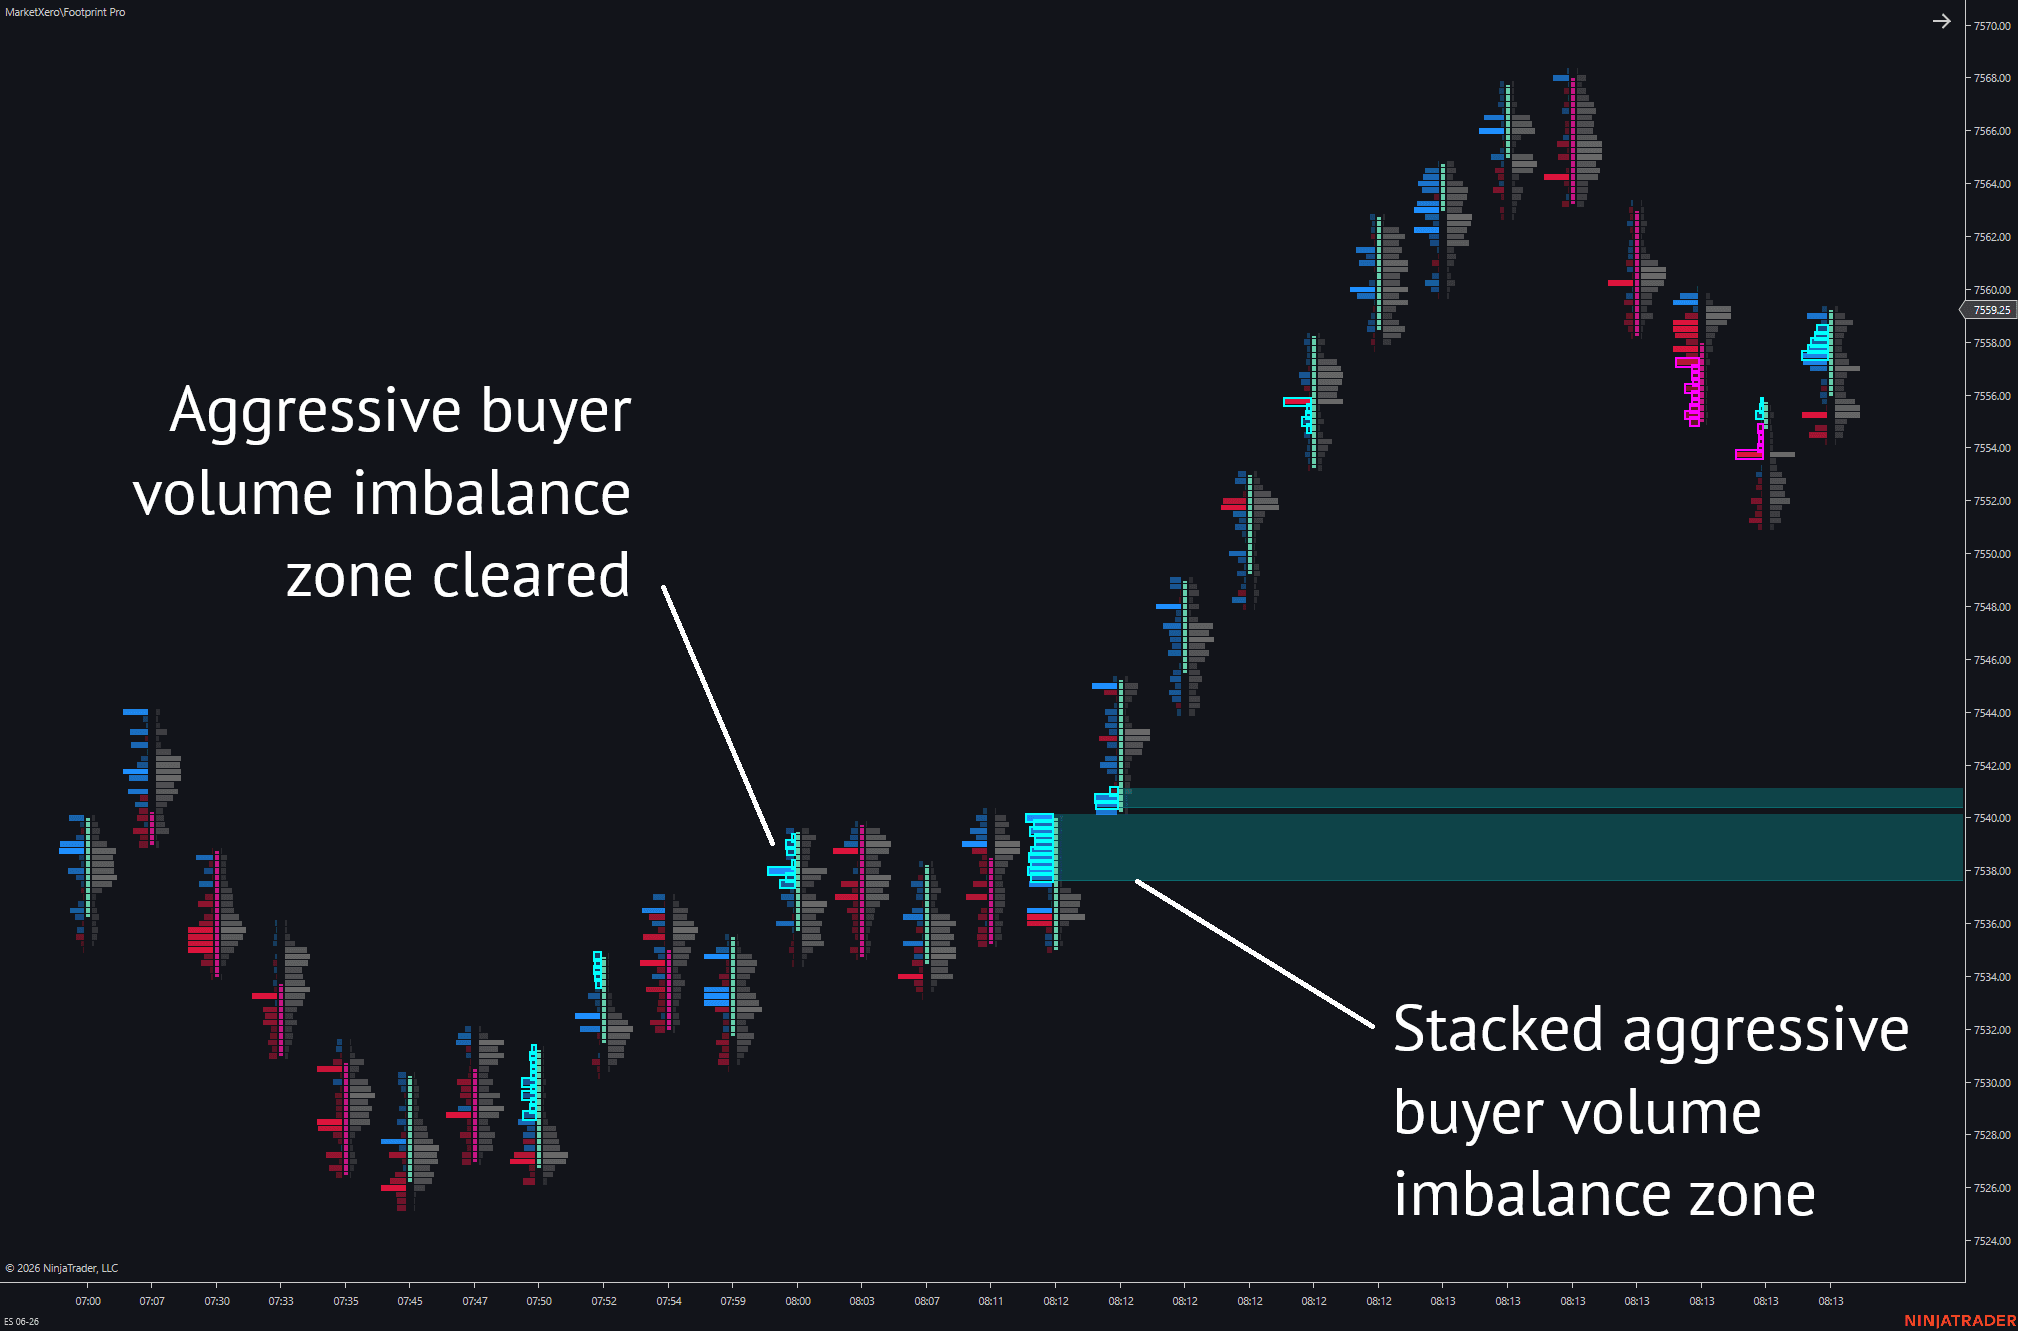
Volume Imbalances
Imbalance detection compares buying and selling activity at adjacent price levels to mark aggression that overwhelmed the opposite side.
- Comparison Mode can be Diagonal or Horizontal.
- Imbalance Ratio defines the required ratio between compared volumes, such as 2:1 or 3:1.
- Minimum Imbalance Delta adds an absolute contract filter so tiny prints do not qualify.
- Bid and Ask Imbalance Color control the side-specific highlights.
- Show Imbalance Zones projects stacked imbalance clusters forward.
- Minimum Adjacent Levels controls how many consecutive imbalance levels are required before a zone is created.
- Imbalance Persistence Mode controls whether historical bars keep all highlights, only stacked-zone highlights, or no historical highlights.
Zero Prints
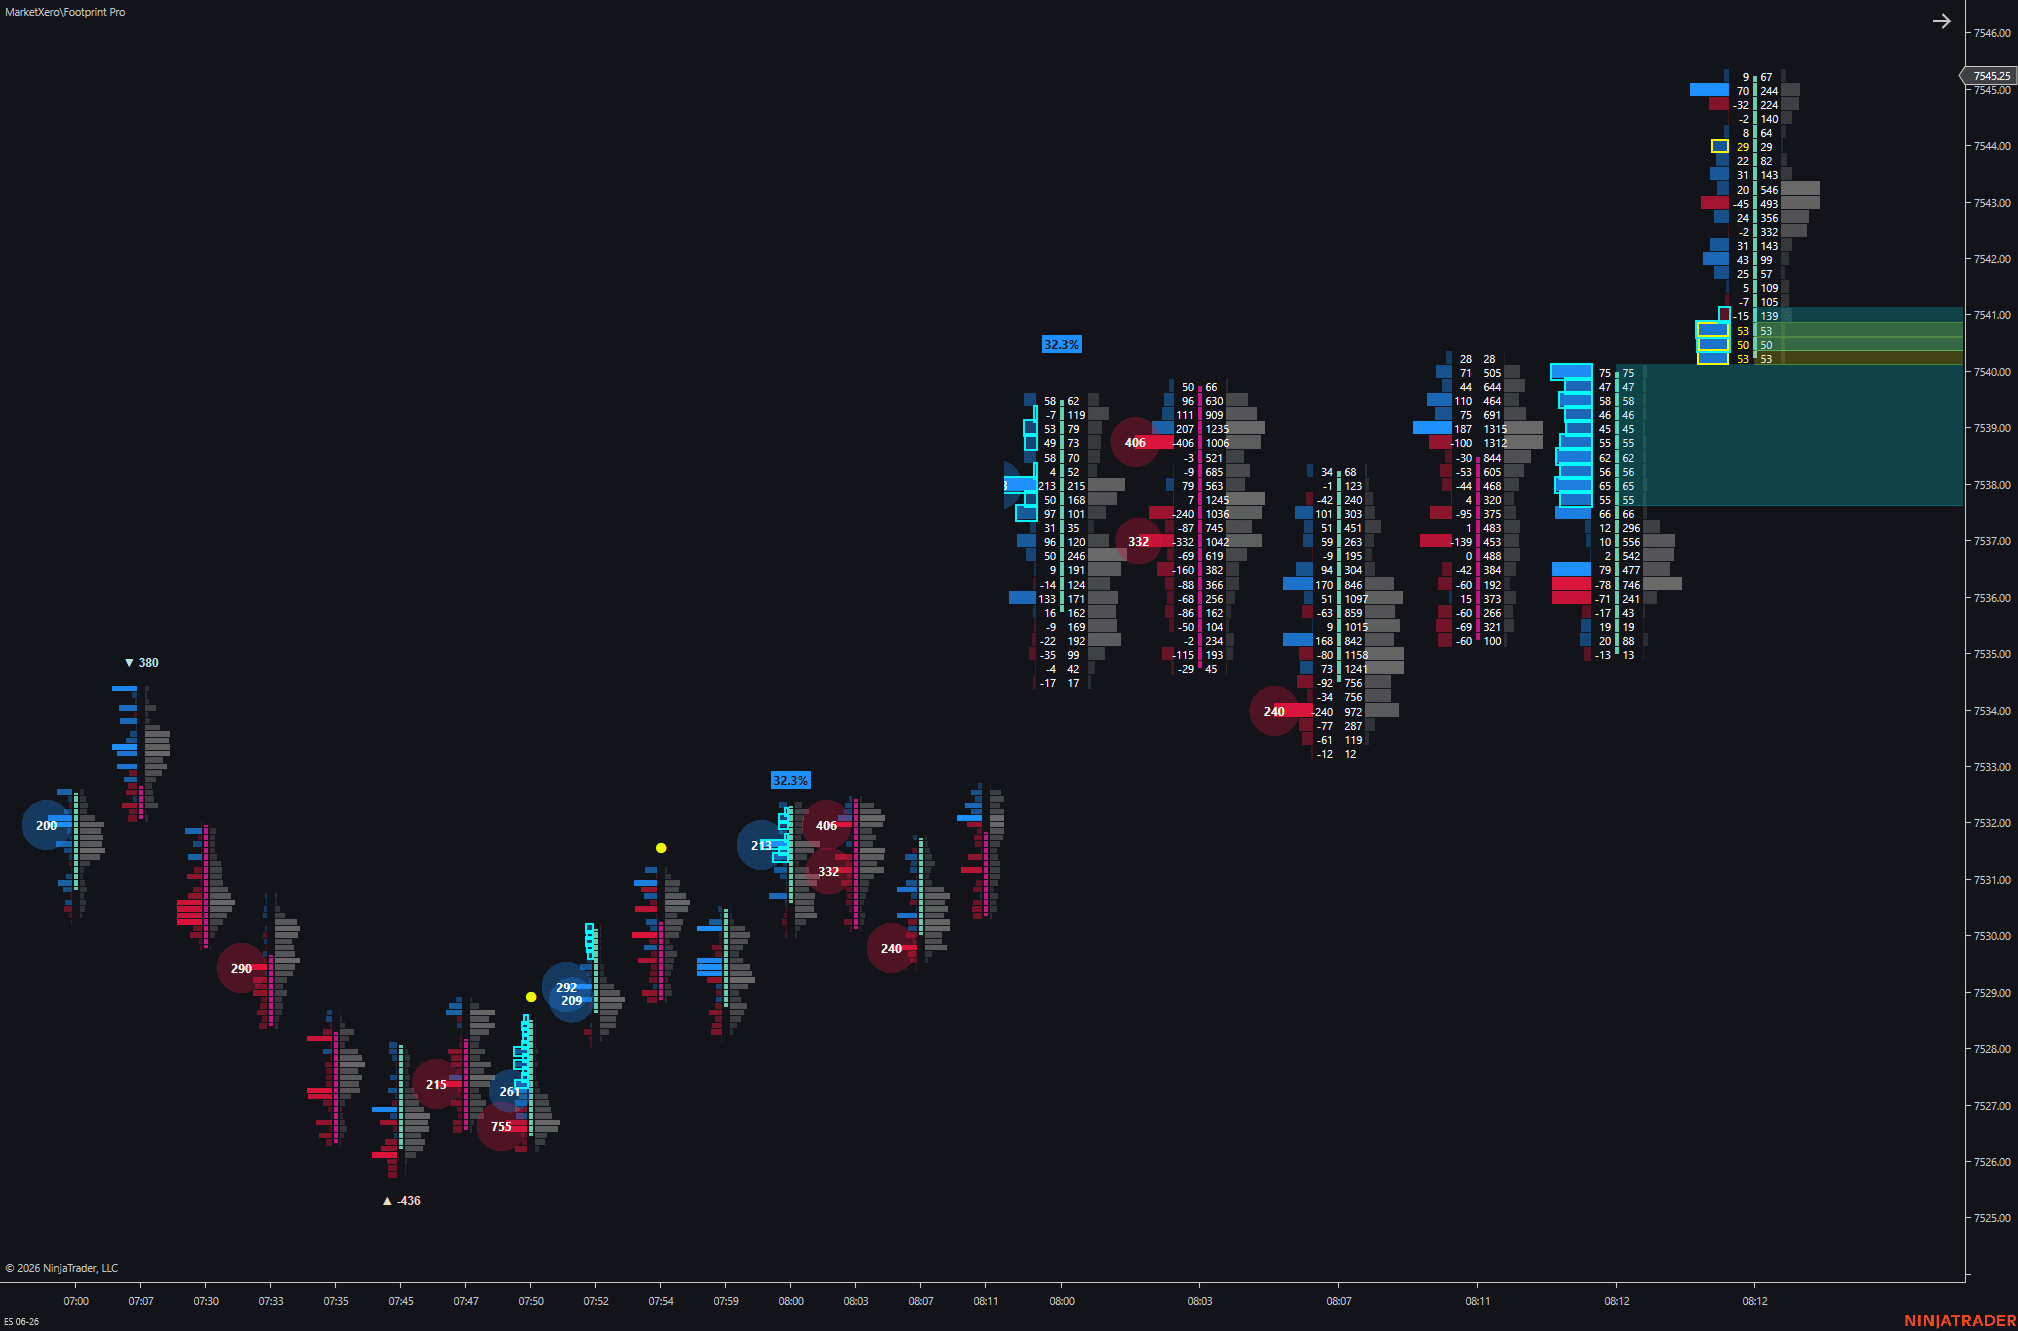
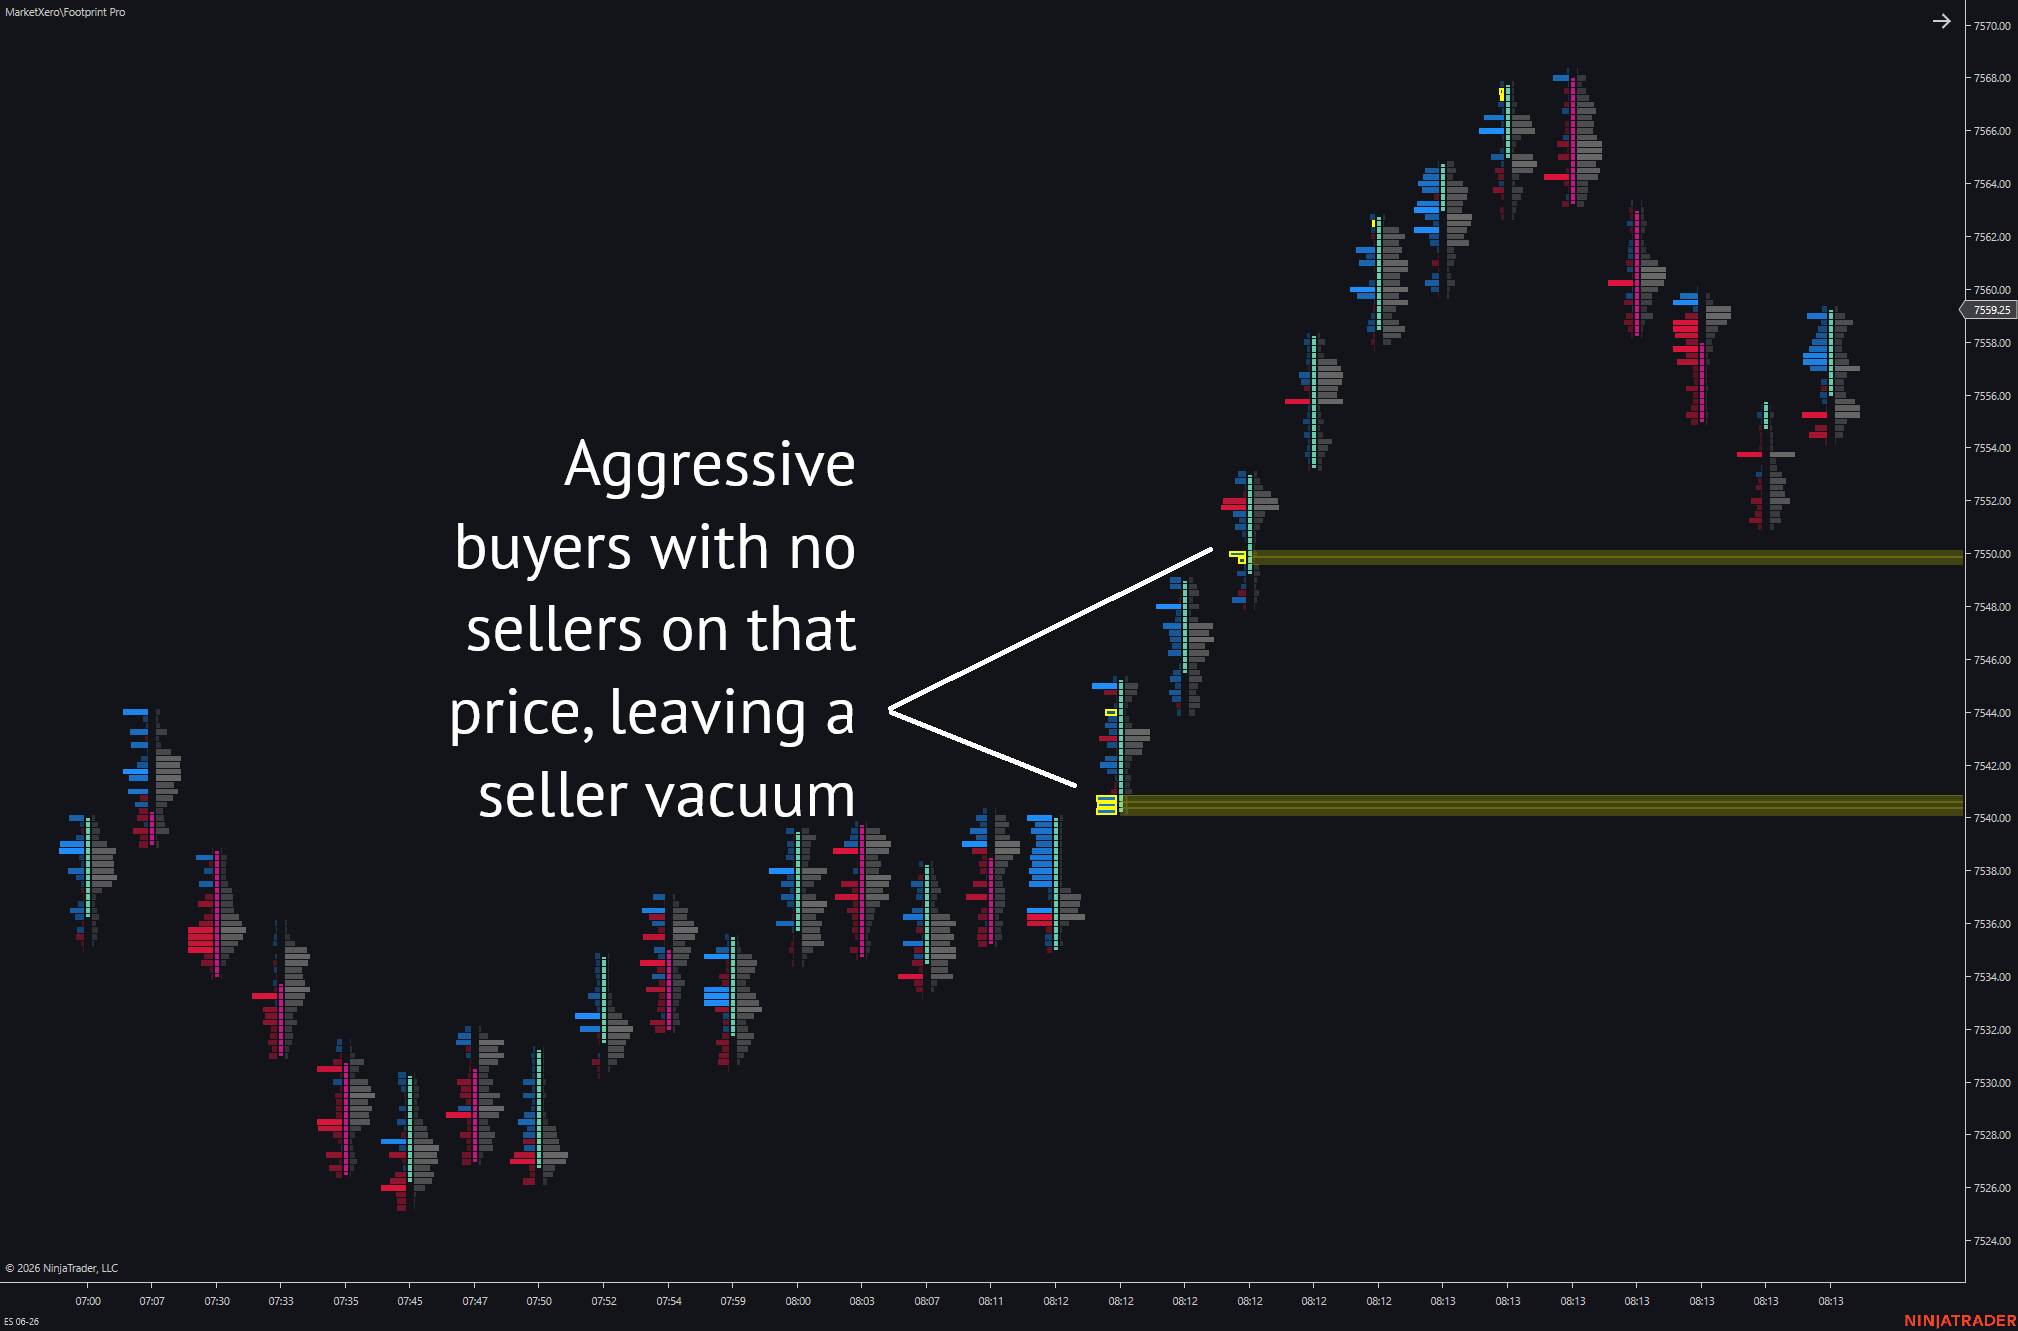
Zero prints identify prices where one side of the auction traded nothing while the other side traded enough volume to qualify.
- Min Zero Print Value requires enough volume on the non-zero side before a zero print is valid.
- Ignore High/Low Zero Prints filters edge prints that often appear at bar extremes.
- Extend Zero Print Zones projects zero print areas forward.
- Zero Print Removal Option controls invalidation: Volume Fill or Price Touch.
- Limit ZP To One Per Scope keeps only the first valid zero print at each price inside the selected scope.
- Zero Print Session Scope can be RTH or Full Trading Day.
- Persist Zero Print Highlights keeps the original historical highlight visible after an extended zone has been invalidated.
Bubbles, POC, And Value Area
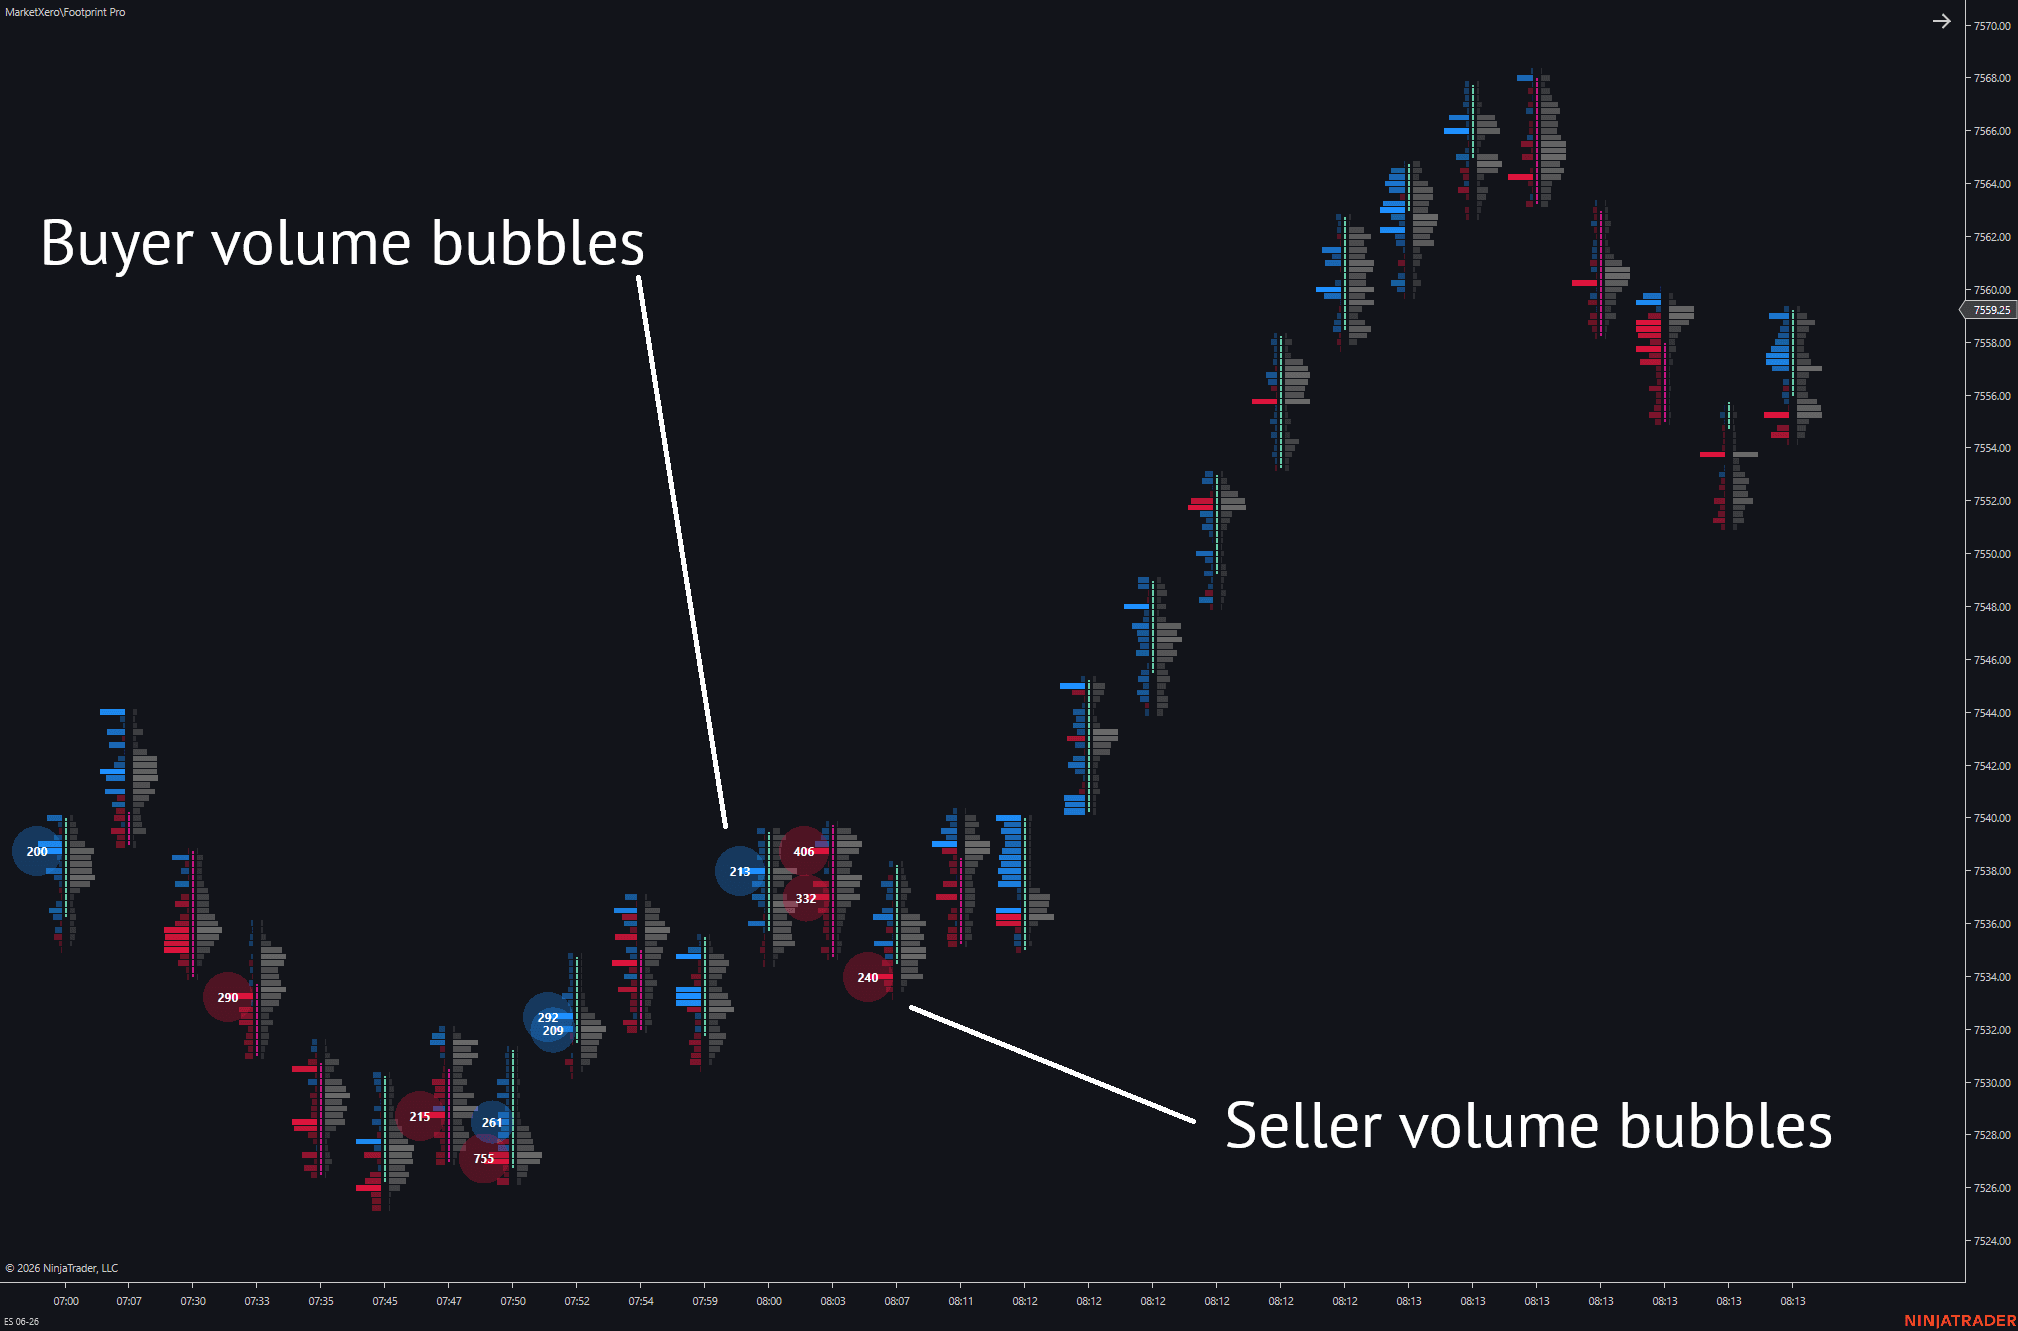
The indicator has two separate context layers: threshold bubbles for unusually large prints and POC/value-area lines for distribution inside each bar.
- Bid, ask, delta, and total bubbles each use a contract threshold plus a percentage threshold. Both must pass.
- Bubble Min Diameter and Bubble Max Diameter control the size range.
- Bubble Volume Text prints the qualifying value inside bubbles when the bubble is large enough.
- Enable Bubble Merging combines adjacent qualifying levels into one larger bubble.
- POC can be highlighted by bid, ask, delta, or total volume.
- Value Area Percent defaults to the market-profile style concept of containing a selected percentage of volume.
- VAH/VAL lines can be enabled for bid, ask, delta, or total distribution.
Trading Workflow
Use Footprint after the level is already defined. The clean sequence is structure first, execution second.
- Define the trade location with Key Levels, Volume Profile, prior session references, or your own plan.
- Wait for price to reach the area instead of reading every footprint bar in isolation.
- Use divergence to spot absorption, not to chase every reversal attempt.
- Use stacked imbalances and bubbles to judge whether initiative is actually pressing through the level.
- Use zero prints and POC/VAH/VAL as references for retests and unfinished auction behavior.
- Save one clean template for Volumetric use and a separate template for non-volumetric charts.
FAQ
Short answers for setup and first-use questions.
Do I need a Volumetric chart?
Use a Volumetric chart for the full per-price ladder, POC, value area, and zero prints. Non-volumetric charts reach feature parity for the rest — divergence, zero prints, stacked imbalances, bubbles, and delta percentages — using an internal tick engine, with no Tick Replay required.
Should Tick Replay be on?
No. Keep Tick Replay off on both Volumetric and non-volumetric charts. Volumetric charts already provide native bid/ask data, and non-volumetric charts use Footprint's internal 1-tick engine. The indicator warns you if Tick Replay is enabled.
What should I enable first?
Start with Display Mode, text threshold, and core colors. Add divergence, imbalances, zero prints, and bubbles only after the base ladder is readable.